Our Team has been day trading since 2017. We have tested out hundreds of tools and pointed out the ones which are the most efficient in terms of providing the right data for the technical analysis, managing the risks and improving the expected value of trades.
Alex Zukutoke
CEO Cryptovizor
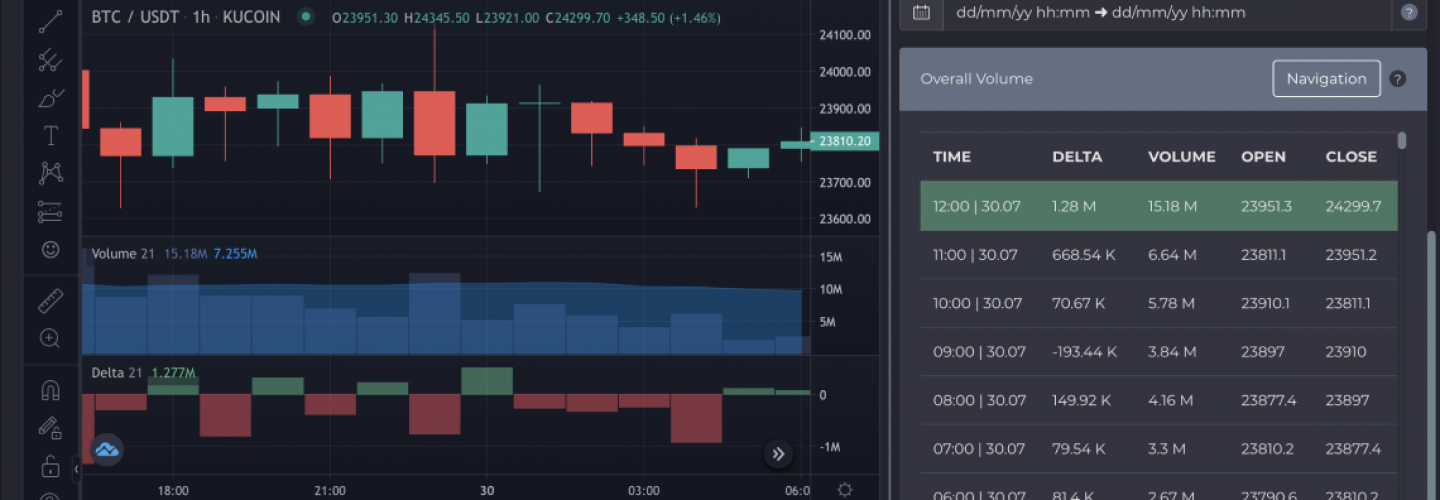
Delta BTC
Delta Chart Advantages
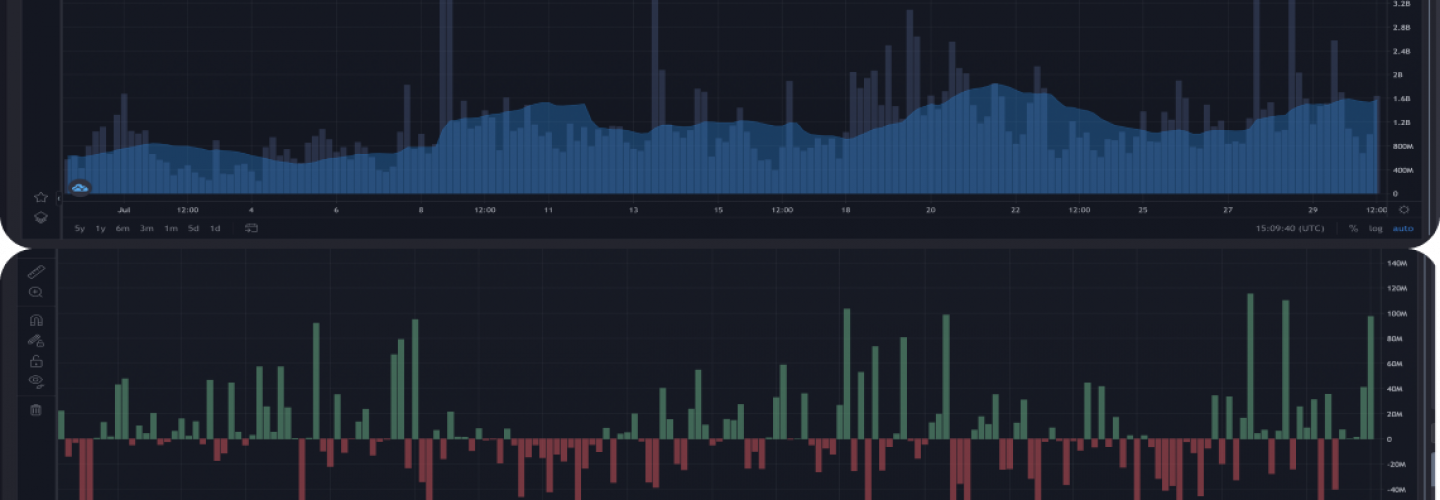
Aggregated BTC trading volume and delta
The weighted average exchange price chart
The current BTC price is shown
Trading volume and delta indicators are a part of the price chart
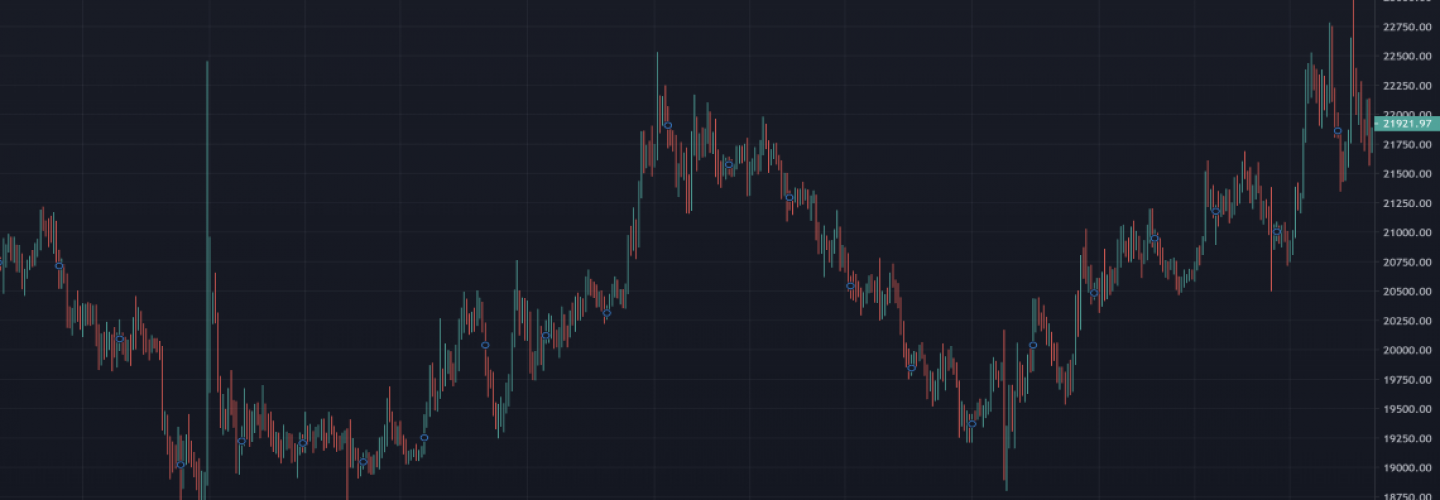
Integrated TradingView with all the features
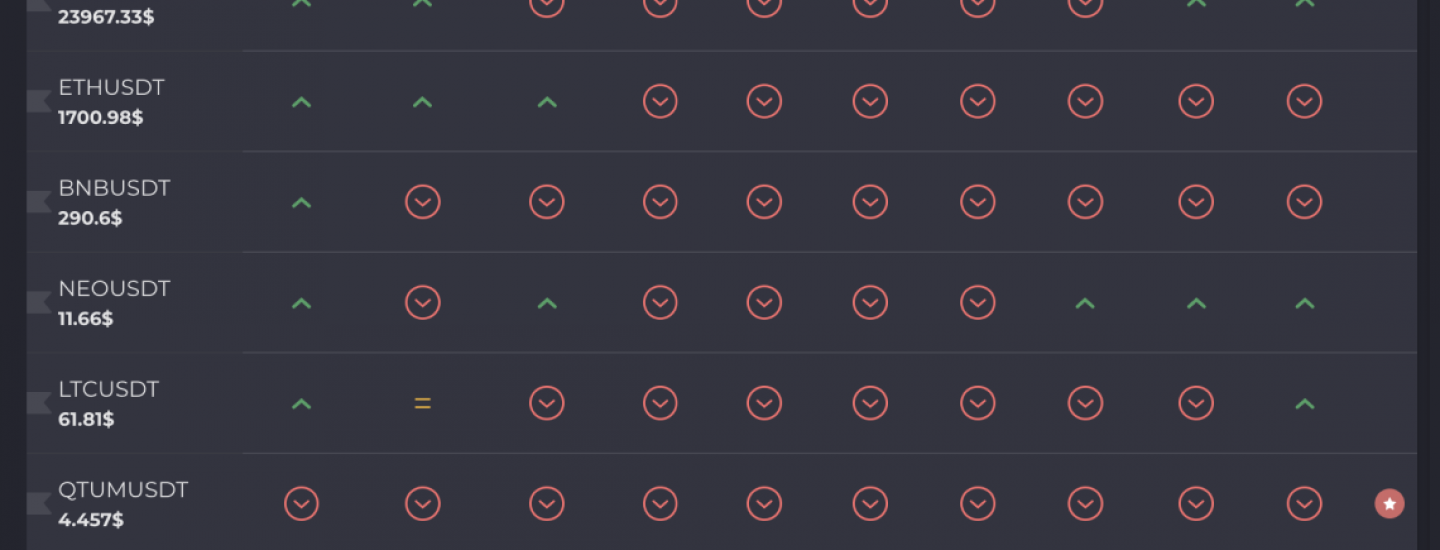
All USDT trading pairs Screener
Binance Spot + Futures
Real-Time Data from Binance
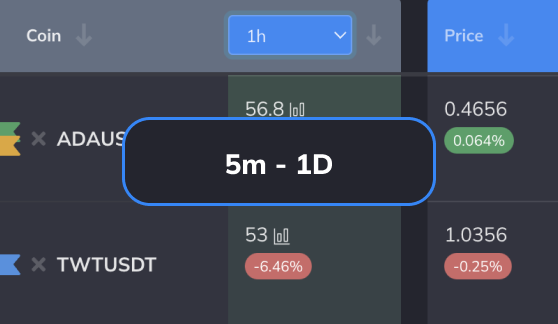
5m, 15m, 30m, 1H, 2H, 4H, 12H, 1D time frames data received from Binance
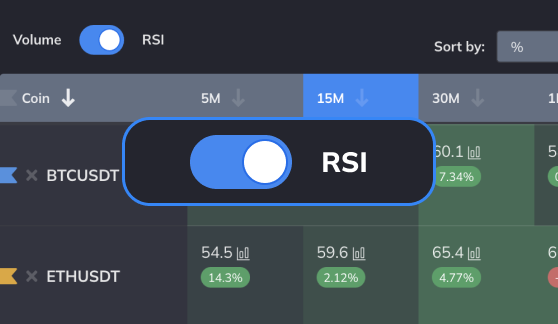
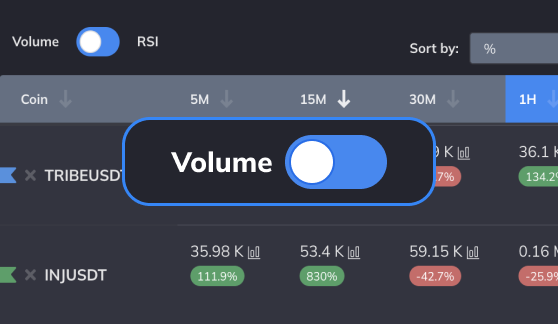
RSI (relative strength index)
Option to sort RSI according to the value or change in %
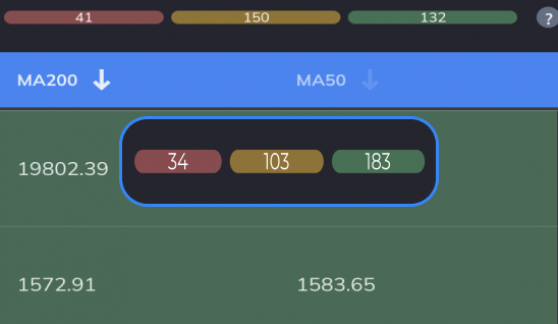
Quick trend detection by MA
Moving average data with customizability
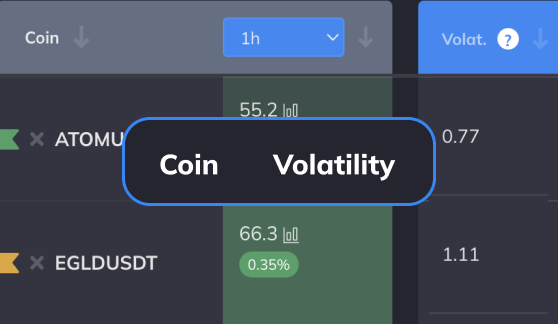
Volatility factor
Volatility indicator for all timeframes
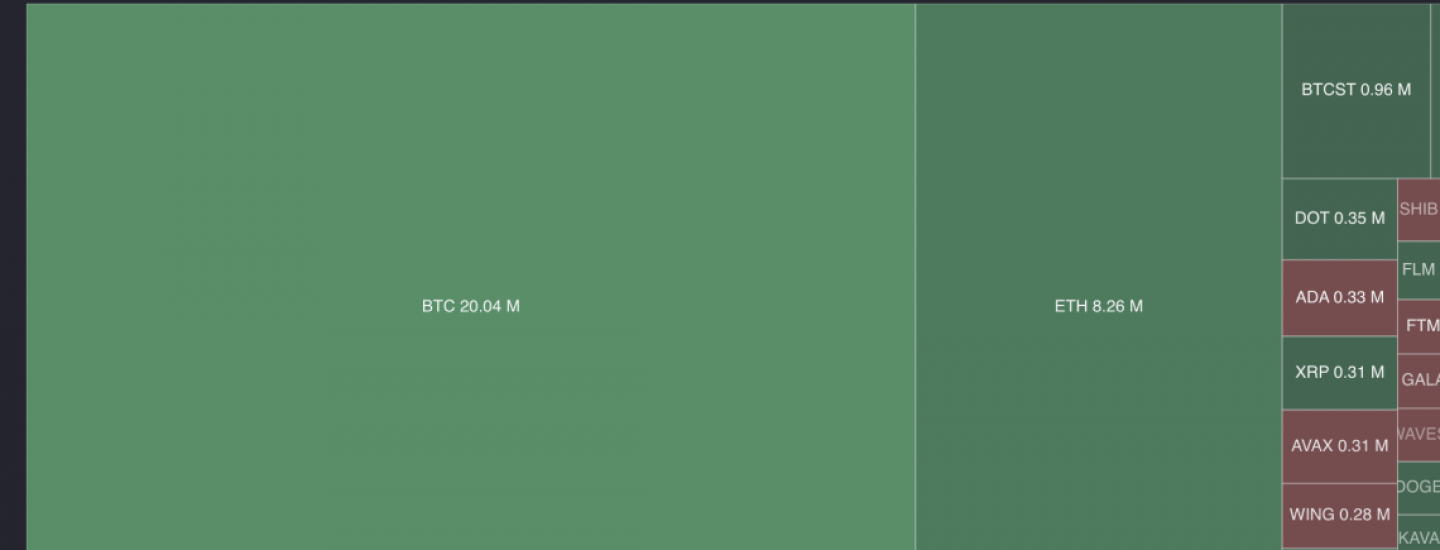
Trading Volume USDT
We use moving trade volume - the best solution for the screener
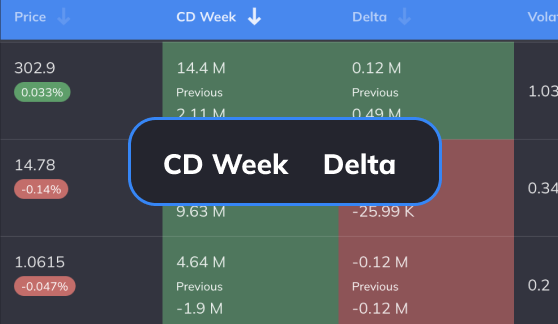
Delta + Cumulative Delta volume
The difference between the volume of market buy and sell orders
Cryptovizor is created by the team of day traders. The features have been chosen according to the basic needs in making every day decisions.
Vet daytrader
There is nothing like Cryptovizor in the market. Everything is in one place and it saves 2 to 3 hours daily letting you focus on trades only
Den daytrader
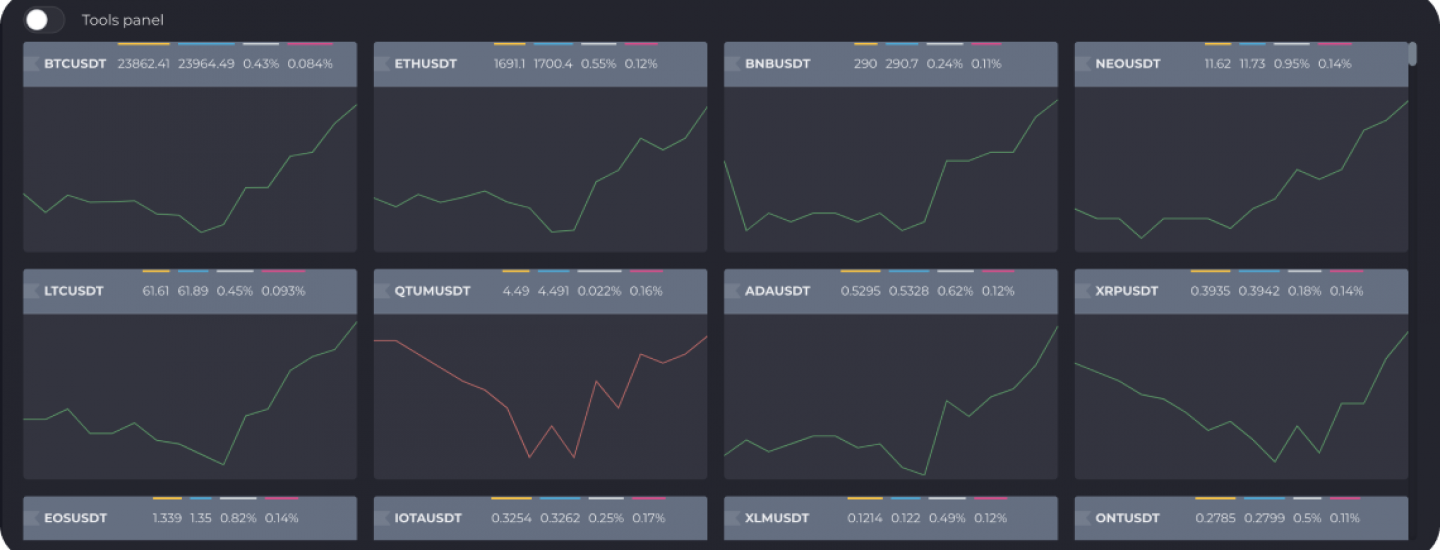
Linear Charts
15m, 30m, 45m, 1H, 2H, 3H, 4H, 6H, 12H, 1D linear charts in one data array
Trends
Trends feature reflects the current trend on the 15m, 30m, 1H, 2H, 4H, 6H, 12H and 1D time periods
We understand the value of getting the right information in a right time. The best case scenario is to be on the edge and get that information earlier than the others. Cryptovizor updates the BTC data every 10 seconds and other crypto assets - every 5 seconds
Personal data security is our main priority. We promise to keep the security and privacy on a high level for each of our users.
Trusted hosting provider being always uptime
3 Active sessions per user
Two-factor Authentication
DDoS Attack Protection
Information about Cryptovizor screener
In the ever-evolving crypto landscape, trading cryptocurrencies comes with its fair share of risks and opportunities. Smart traders know that minimizing losses isn't just about luck—it's about leveraging the right tools and conducting thorough analyses of your assets. That's where Cryptovizor, your go-to crypto screener, steps in, offering a state-of-the-art solution designed to empower your trading decisions with its advanced analytics and comprehensive data aggregation. Discover why it's considered the best crypto screener available today.
Key Features of Cryptovizor: Your Premier Crypto Screener
1. Comprehensive Analytics:
Cryptovizor isn't just another coin screener; it's a revolutionary tool in the realm of decentralized digital assets. It provides a comprehensive suite of analytical tools that are unparalleled in the market. Whether you're a novice or a seasoned trader, Cryptovizor, the best crypto screener, equips you with the insights needed to navigate the complex crypto market confidently.
2. Bitcoin Delta - A Unique Advantage:
The Bitcoin Delta module is a testament to Cryptovizor's innovation. Integrating data from leading crypto exchanges like Binance, Bitstamp, Bitfinex, FTX, Coinbase, Kraken, Huobi, and KuCoin, it offers a consolidated view of the average exchange spot price. This unique feature saves you the hassle of comparing prices across platforms, making it the ultimate crypto screener for informed decision-making.
3. Binance Crypto Screener:
Dive deeper into the Binance ecosystem with Cryptovizor's specialized Binance Futures and Spot crypto screener for USDT pairs. This module is a treasure trove of information, offering real-time data across four dynamic tabs: table, trends, line charts, and heat map. Whether you're tracking intraday trends or analyzing cumulative deltas, this feature ensures you're always one step ahead, solidifying Cryptovizor's status as the best crypto screener.
4. Unmatched Flexibility and Insight:
From customizable time frames to multi-chart views, Cryptovizor's flexibility is unmatched. Filter cryptocurrencies based on uptrend, downtrend, or active trader zones, and visualize asset movements with ease. The integration with TradingView enhances your analytical capabilities, allowing you to mark up and adjust indicators as needed, making it the most versatile crypto screener Binance traders can rely on.
Conclusion:
Cryptovizor stands out as the best crypto screener for traders looking to minimize risks and maximize opportunities. Its unique features, including Bitcoin Delta and the Binance Futures and Spot crypto screener for USDT pairs, offer a level of insight and analysis that's hard to beat. Whether you're new to crypto trading or looking to refine your strategy, Cryptovizor is the tool you need to succeed in the dynamic world of cryptocurrencies.
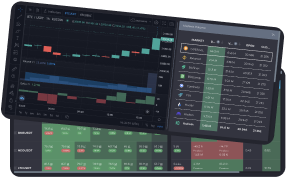


 The market monitor
 Demand and supply analysis
 Real-time market data from the top exchanges
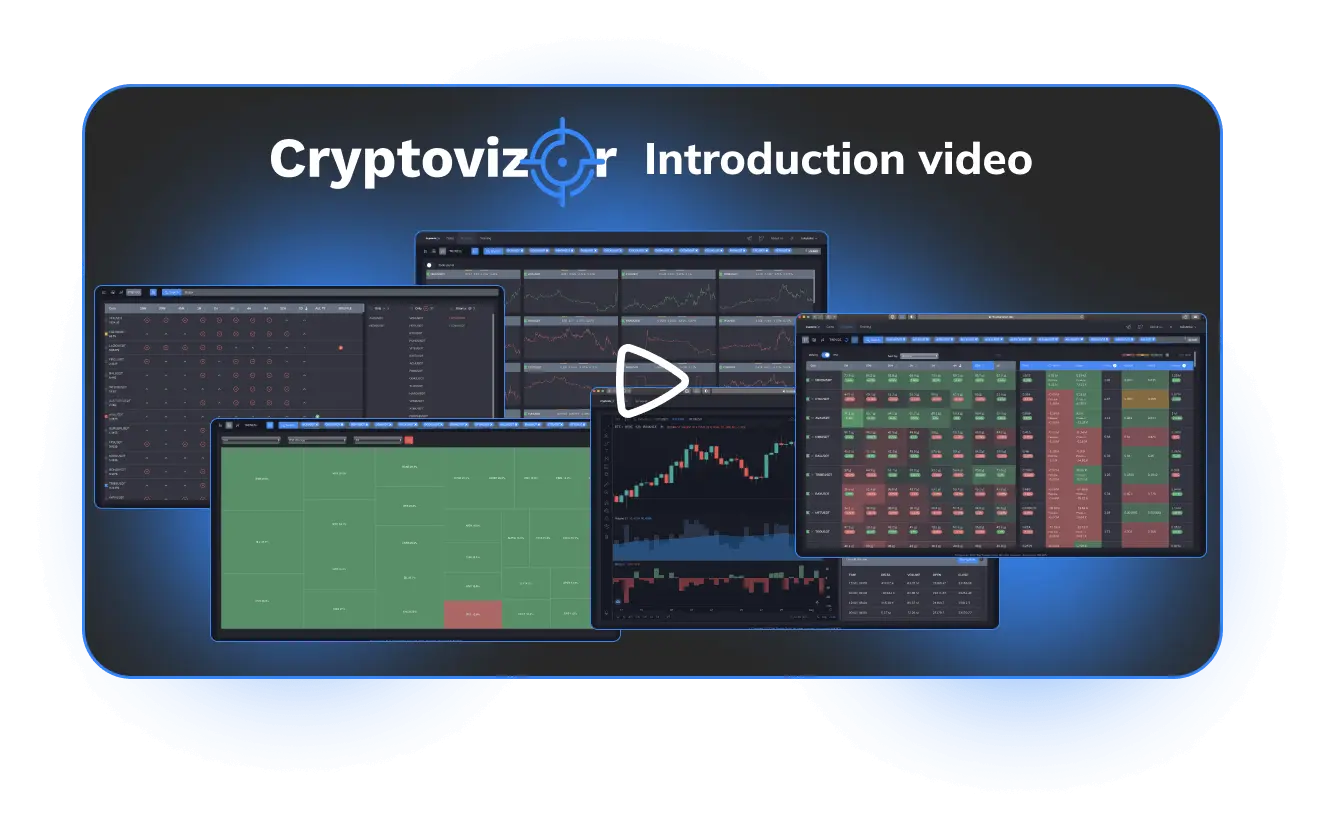


 Binance Spot + Futures