Chaikin Money Flow with Cumulative Delta


The cryptocurrency market is a rapidly expanding arena that has captured the attention of traders worldwide, thanks to its remarkable volatility. This volatility presents substantial profit-making opportunities, but also introduces a heightened risk level. Thus, devising a robust trading strategy is crucial for optimizing gains and curtailing losses.
A pivotal component of numerous trading strategies is the application of indicators.
Trading indicators are formulated through mathematical calculations aimed at analyzing market trends to forecast potential price shifts. These tools are instrumental in pinpointing prospective buying or selling cues, thereby empowering traders with the knowledge to make well-informed decisions.
This piece delves into the Chaikin Money Flow (CMF), a renowned trading indicator not exclusively tied to cryptocurrency trading. We'll explore the workings of the CMF, its application in the crypto trading sphere, and its potential synergy with other indicators to enhance profit margins.
The Significance of Indicators in Crypto Trading
In the exceptionally volatile crypto market, where prices may experience significant swings within mere hours, predicting subsequent market movements can be challenging. Trading indicators serve as a beacon in this unpredictability, offering insights into market trends and identifying patterns. Utilizing these tools, traders can forecast future price trends, leading to more strategic and informed trading decisions.
Beyond the CMF, a plethora of trading indicators are at the disposal of crypto traders. Fibonacci retracements, the Relative Strength Index (RSI), moving averages, and Bollinger Bands are among the widely embraced indicators known for their efficacy in signaling potential buying or selling opportunities.
It's critical to acknowledge that no single indicator guarantees absolute market foresight. Nevertheless, the concurrent use of multiple indicators and the examination of various timeframes significantly bolster the likelihood of executing profitable transactions.
Understanding Chaikin's Cash Flow (CMF) as a trading indicator
Chaikin Money Flow indicator is calculated based on the volume and price of the asset. It uses a formula that takes into account changes in price and volume over a certain period.
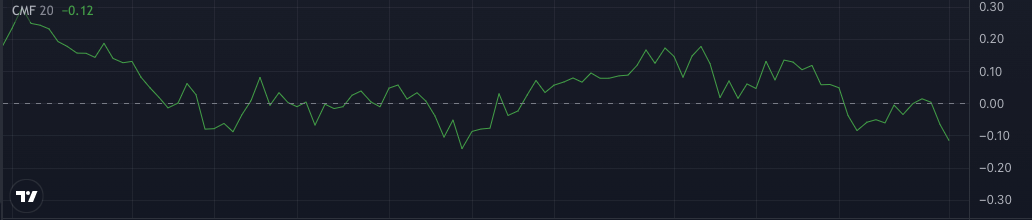
CMF indicator can take values from (-1) to (1)
If the indicator is above zero, it means that cash flow into assets exceeds cash flow out of assets. If the indicator is below zero, it means that cash flow from assets exceeds cash flow to assets
CMF components and how it works
CMF is based on two key components - cash flow volume and cash flow multiplier. Cash flow volume is calculated by multiplying the average price of an asset by the trading volume. The cash flow multiplier is calculated based on whether the price is moving up or down.
The formula looks like this:
CMF = ∑ Volume × [(Close - Low) - (High - Close)] / (High - Low) / Period
Money Flow Multiplier = [(Close - Low) - (High - Close)] / (High - Low)
Money Flow Volume = Money Flow Multiplier × Volume for the Period
CMF = [Cash Flow Volume for 20 Period] / [20 Volume Period]
The CMF indicator has a period parameter, for which the cash flow calculation is taken into account. By default, it is equal to 20 periods.
Since we are talking about trends, it is best to use this oscillator on higher timeframes
CMF indicator interpretation
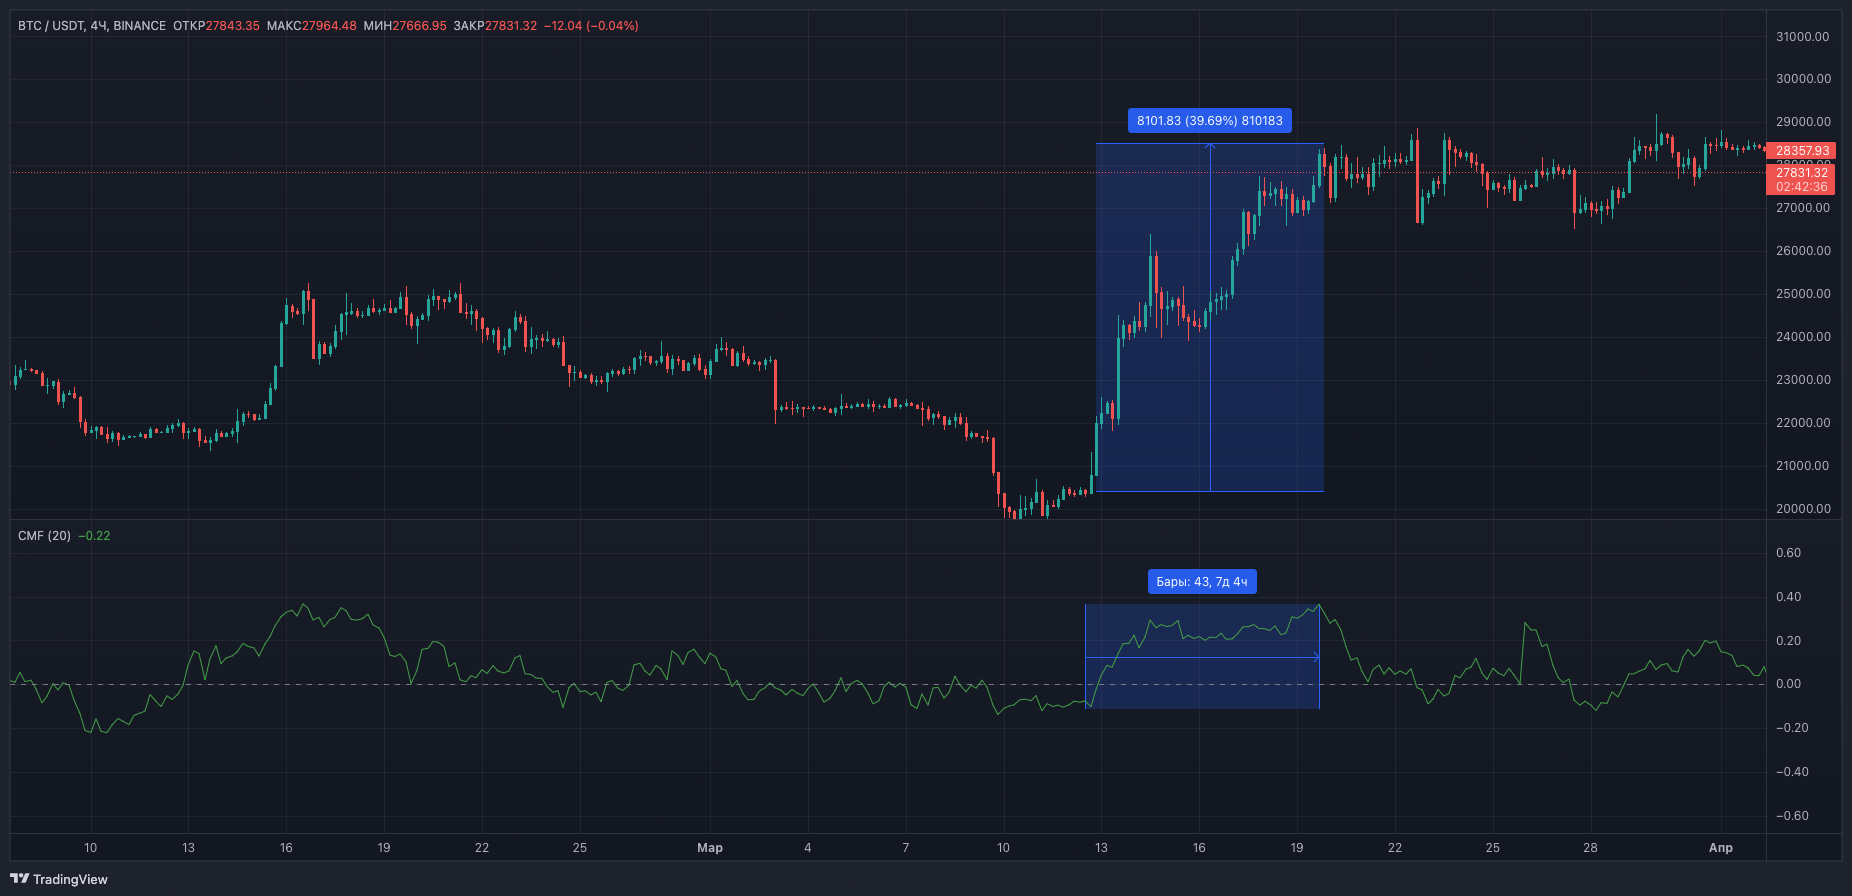
• If the CMF is positive and rising, it indicates buying pressure and the uptrend can continue
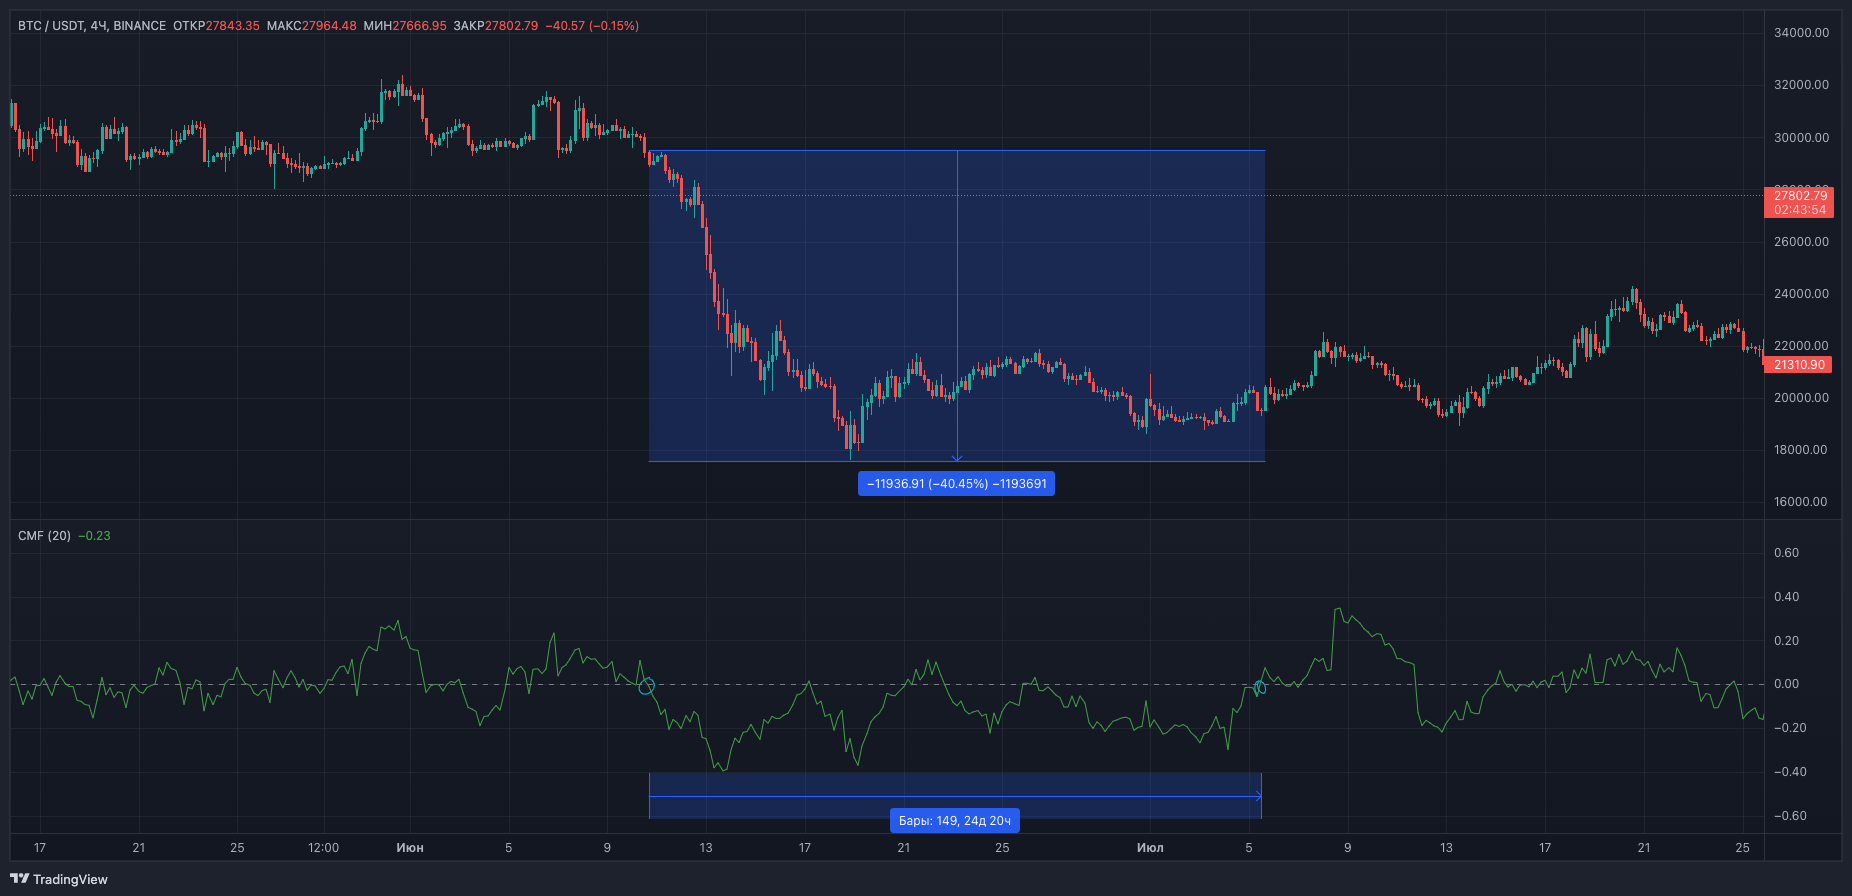
• If the CMF is negative and falling, it indicates seller pressure and the downtrend may continue
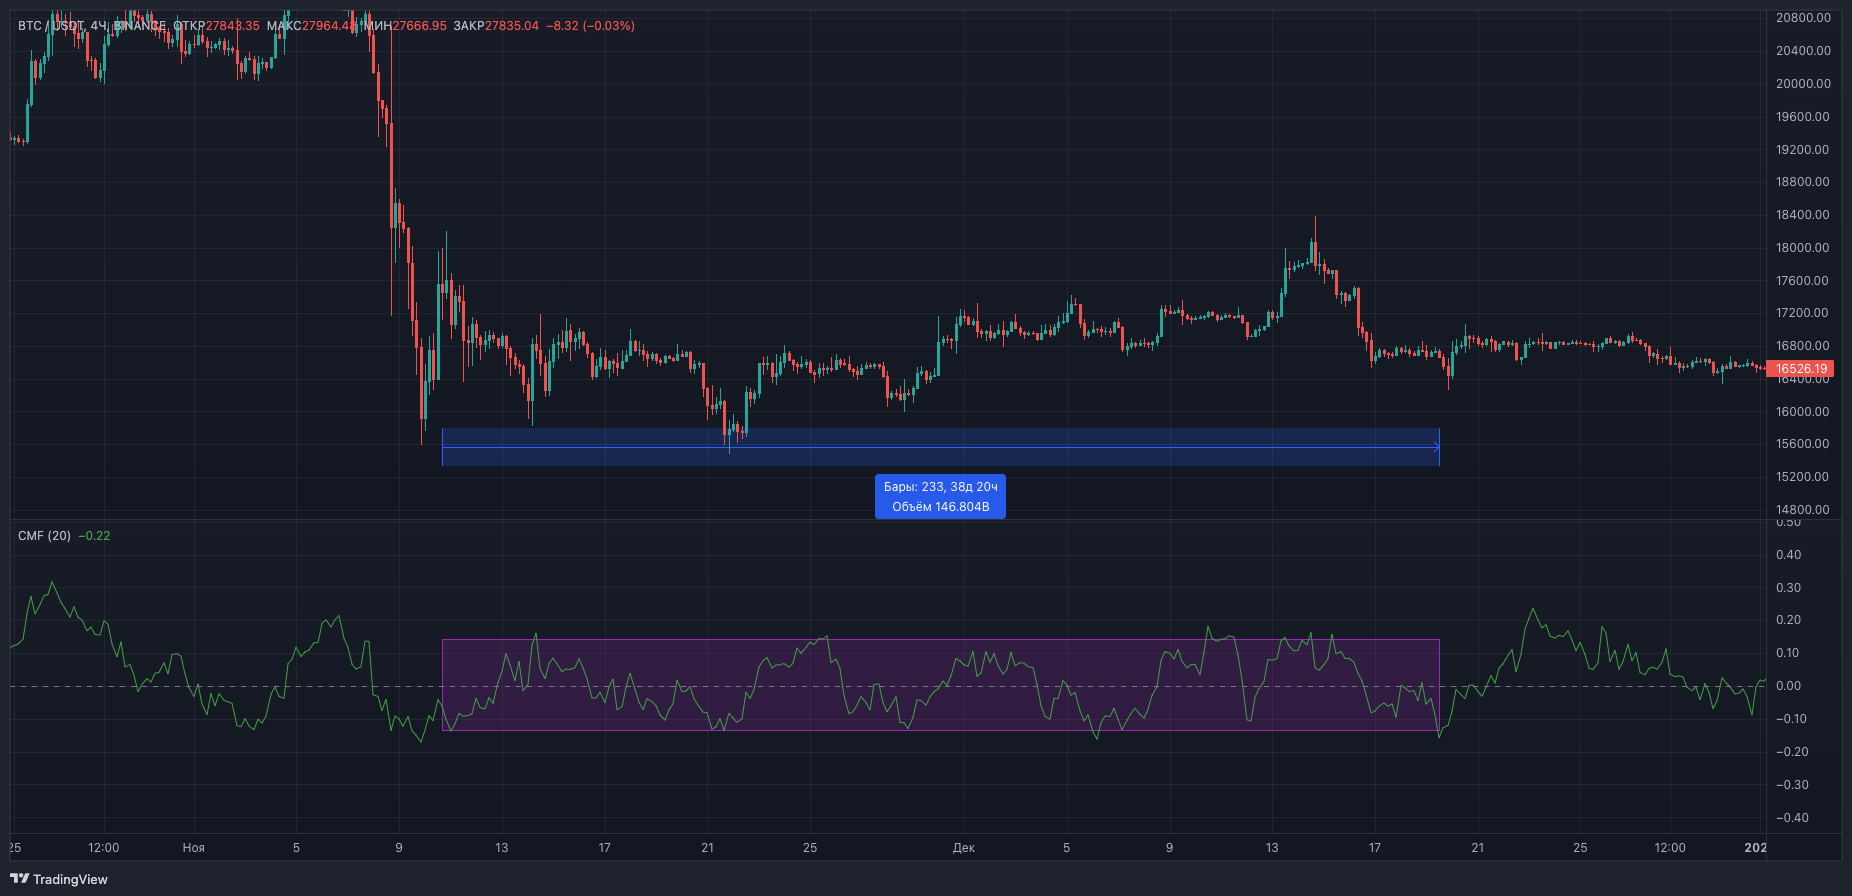
• If the CMF fluctuates around zero, this indicates an equilibrium between buyers and sellers, then the trend can be uncertain and the market is flat
How to use CMF in cryptocurrency trading?
To use CMF in cryptocurrency trading, traders must first select an asset to trade and then apply the CMF indicator to the trading chart. The CMF line will appear on the chart and traders can use it to identify potential buy or sell signals.
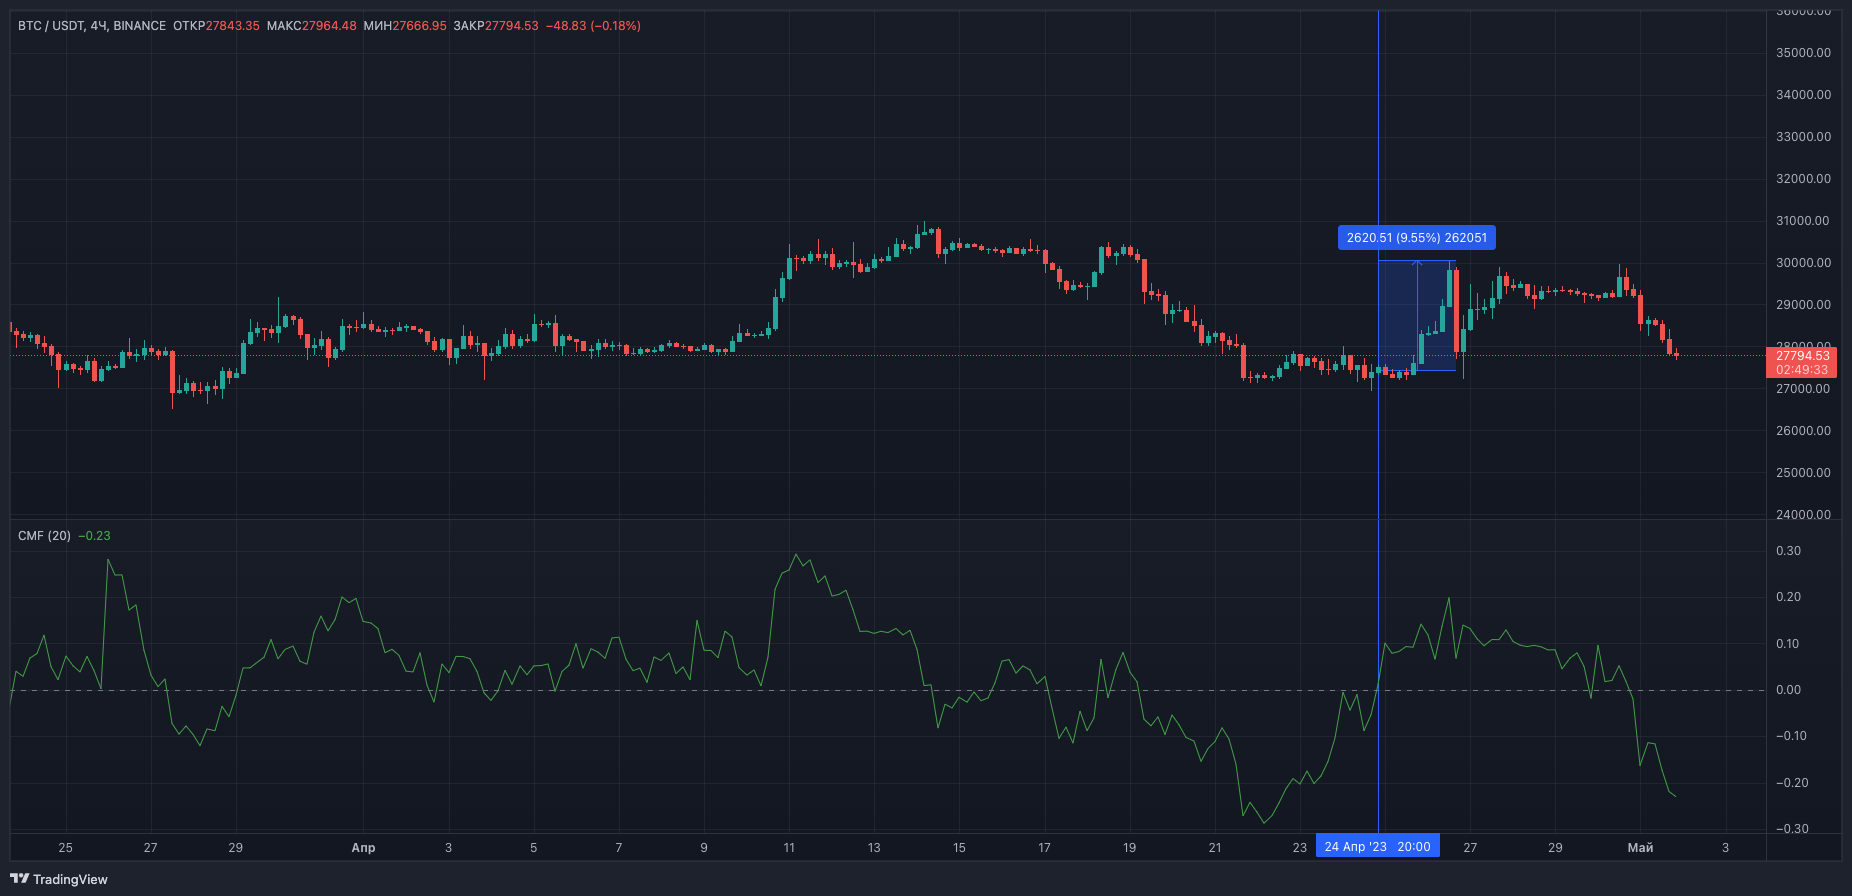
• Buy signal: CMF crosses the zero line from bottom to top
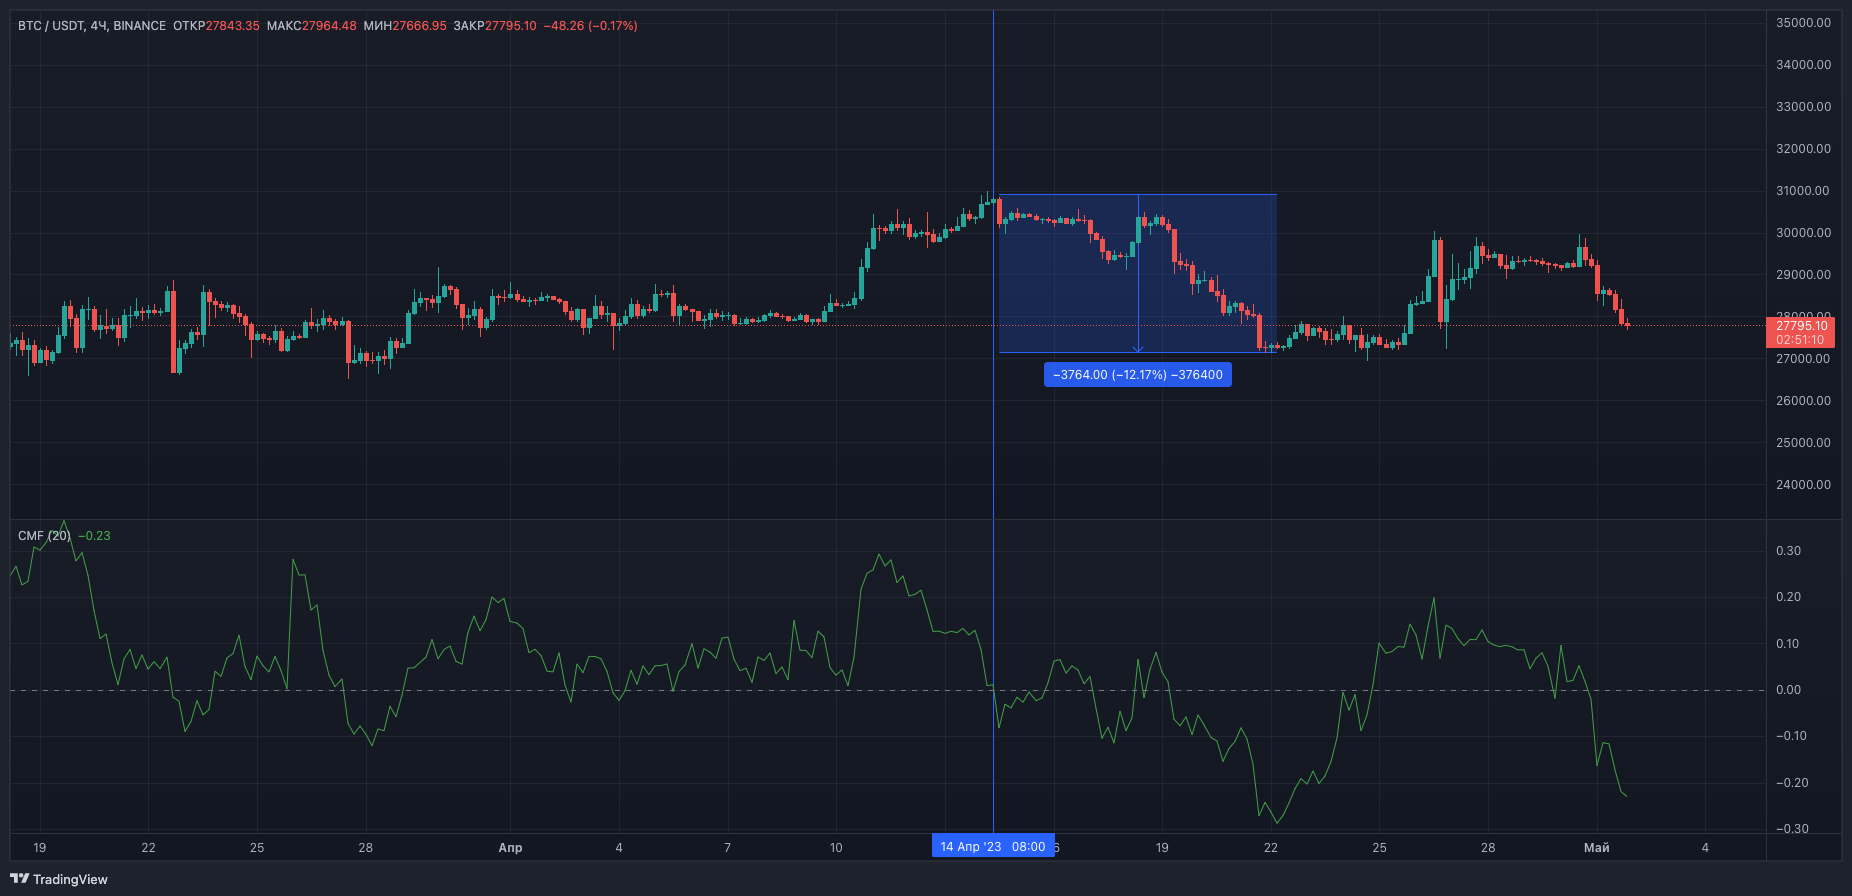
• Sell signal: CMF crosses the zero line from top to bottom.
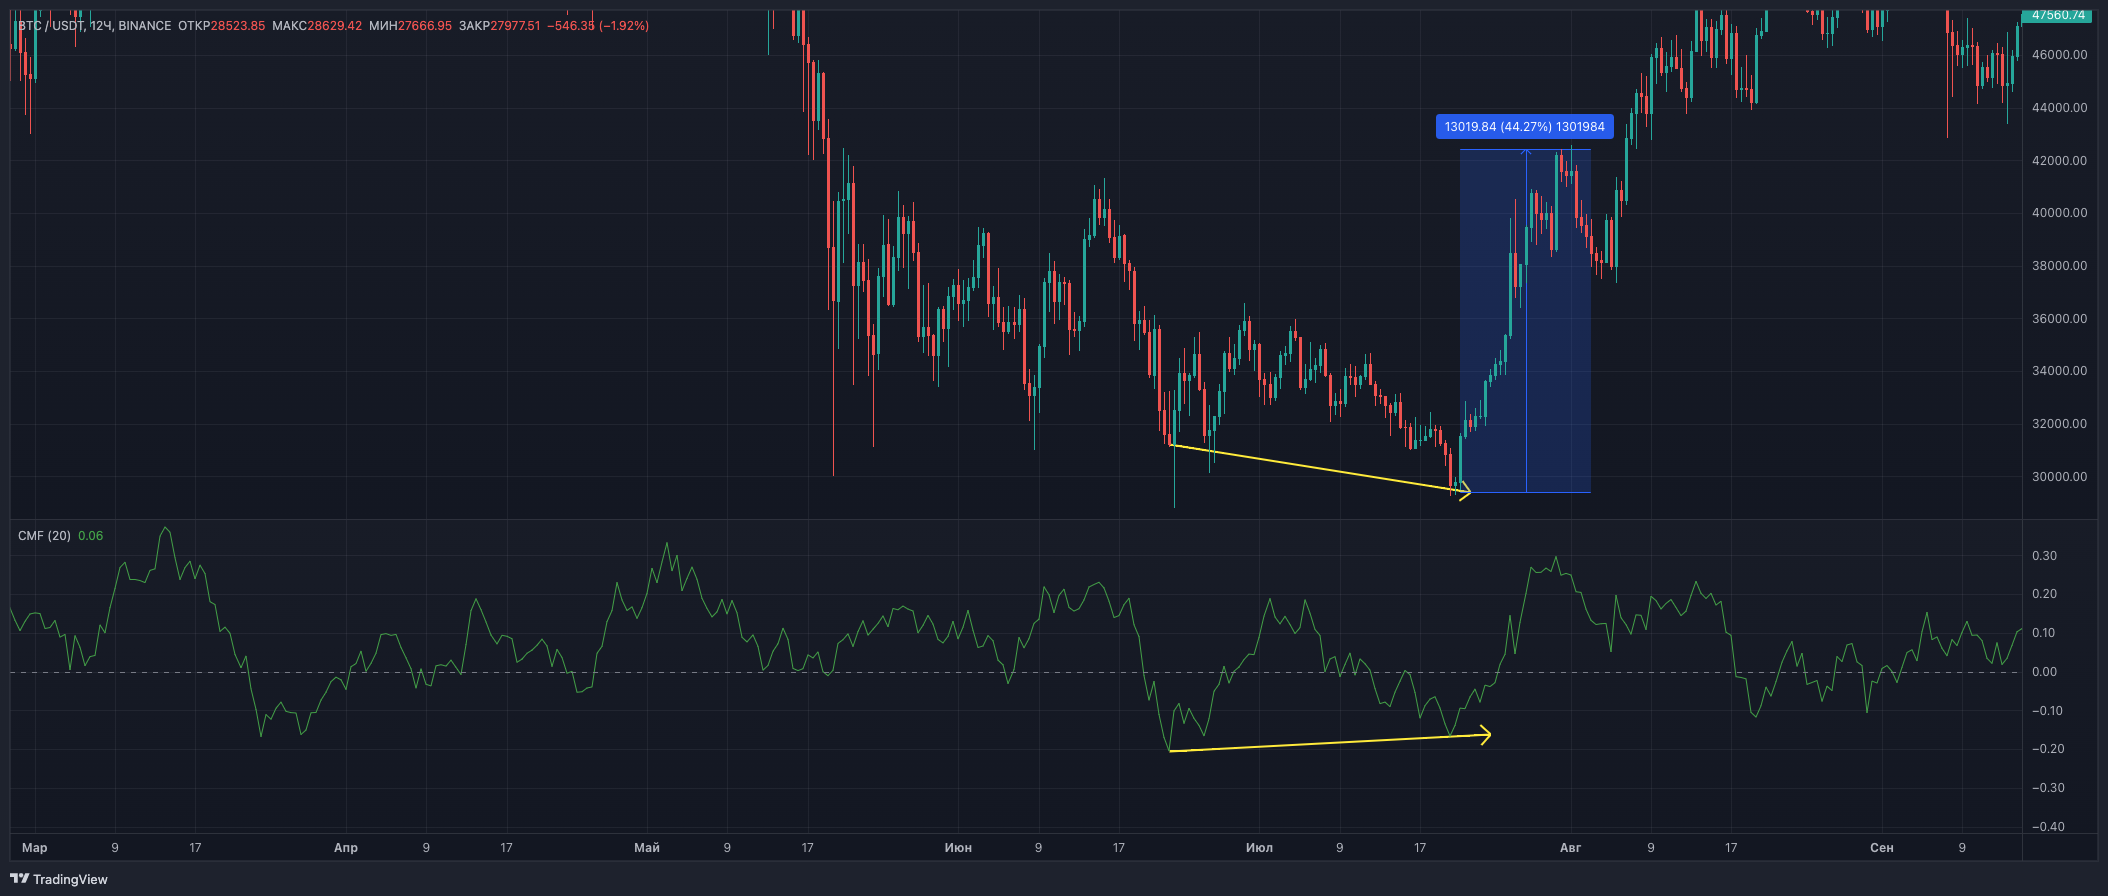
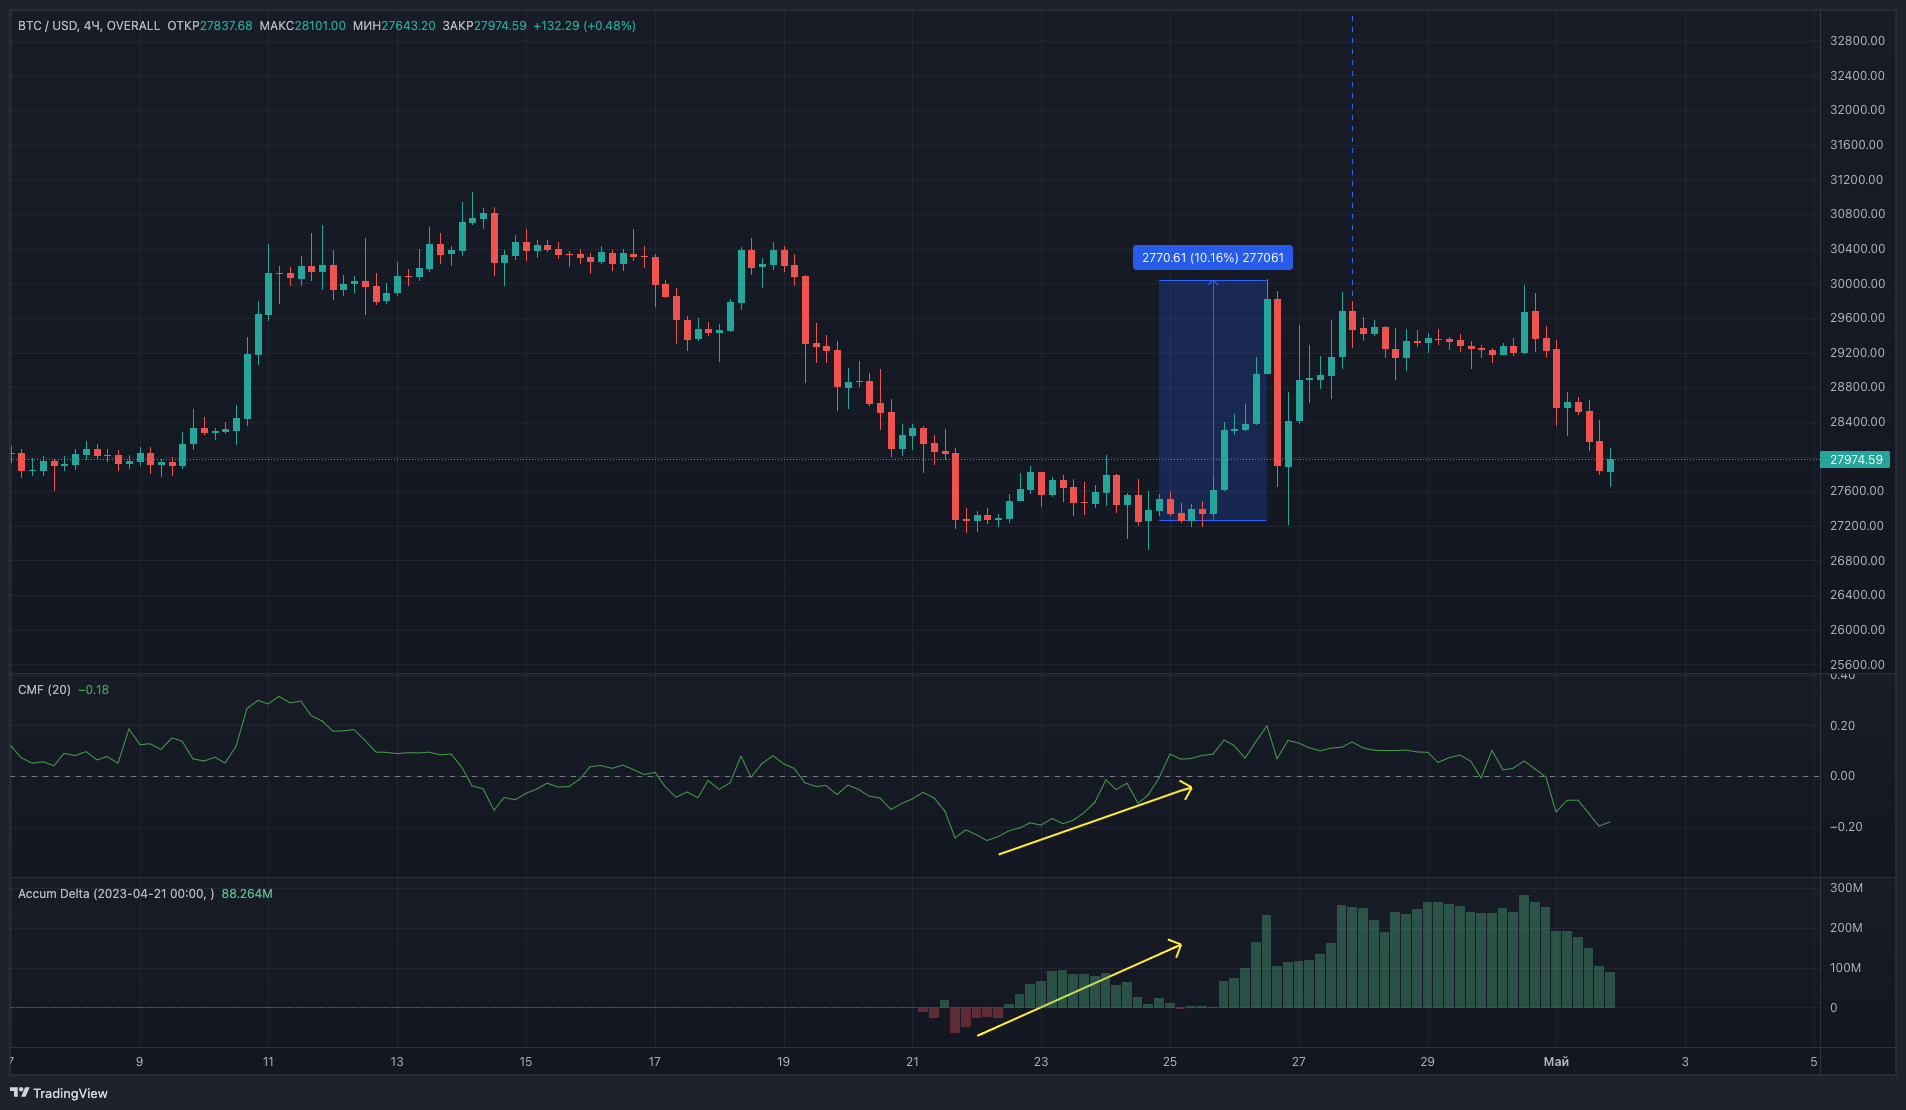
• Convergence: If the price of an asset is falling and the CMF is rising, it may indicate a potential reversal upwards.
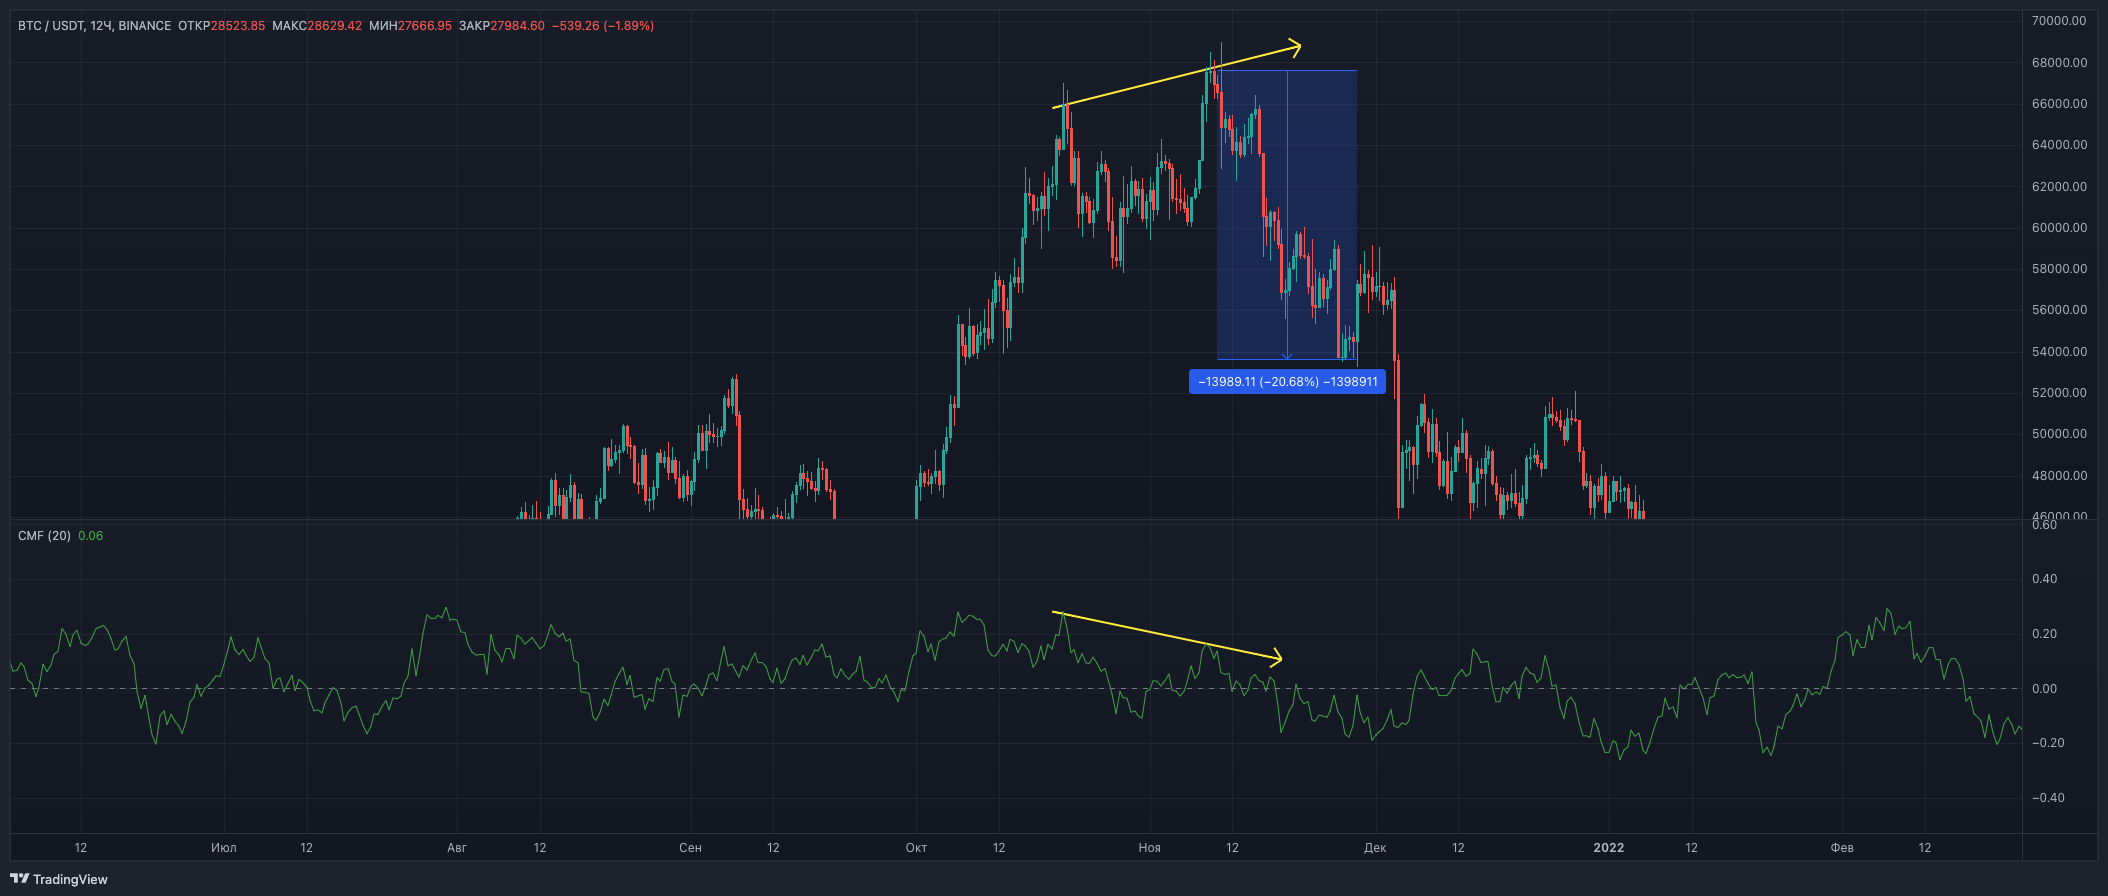
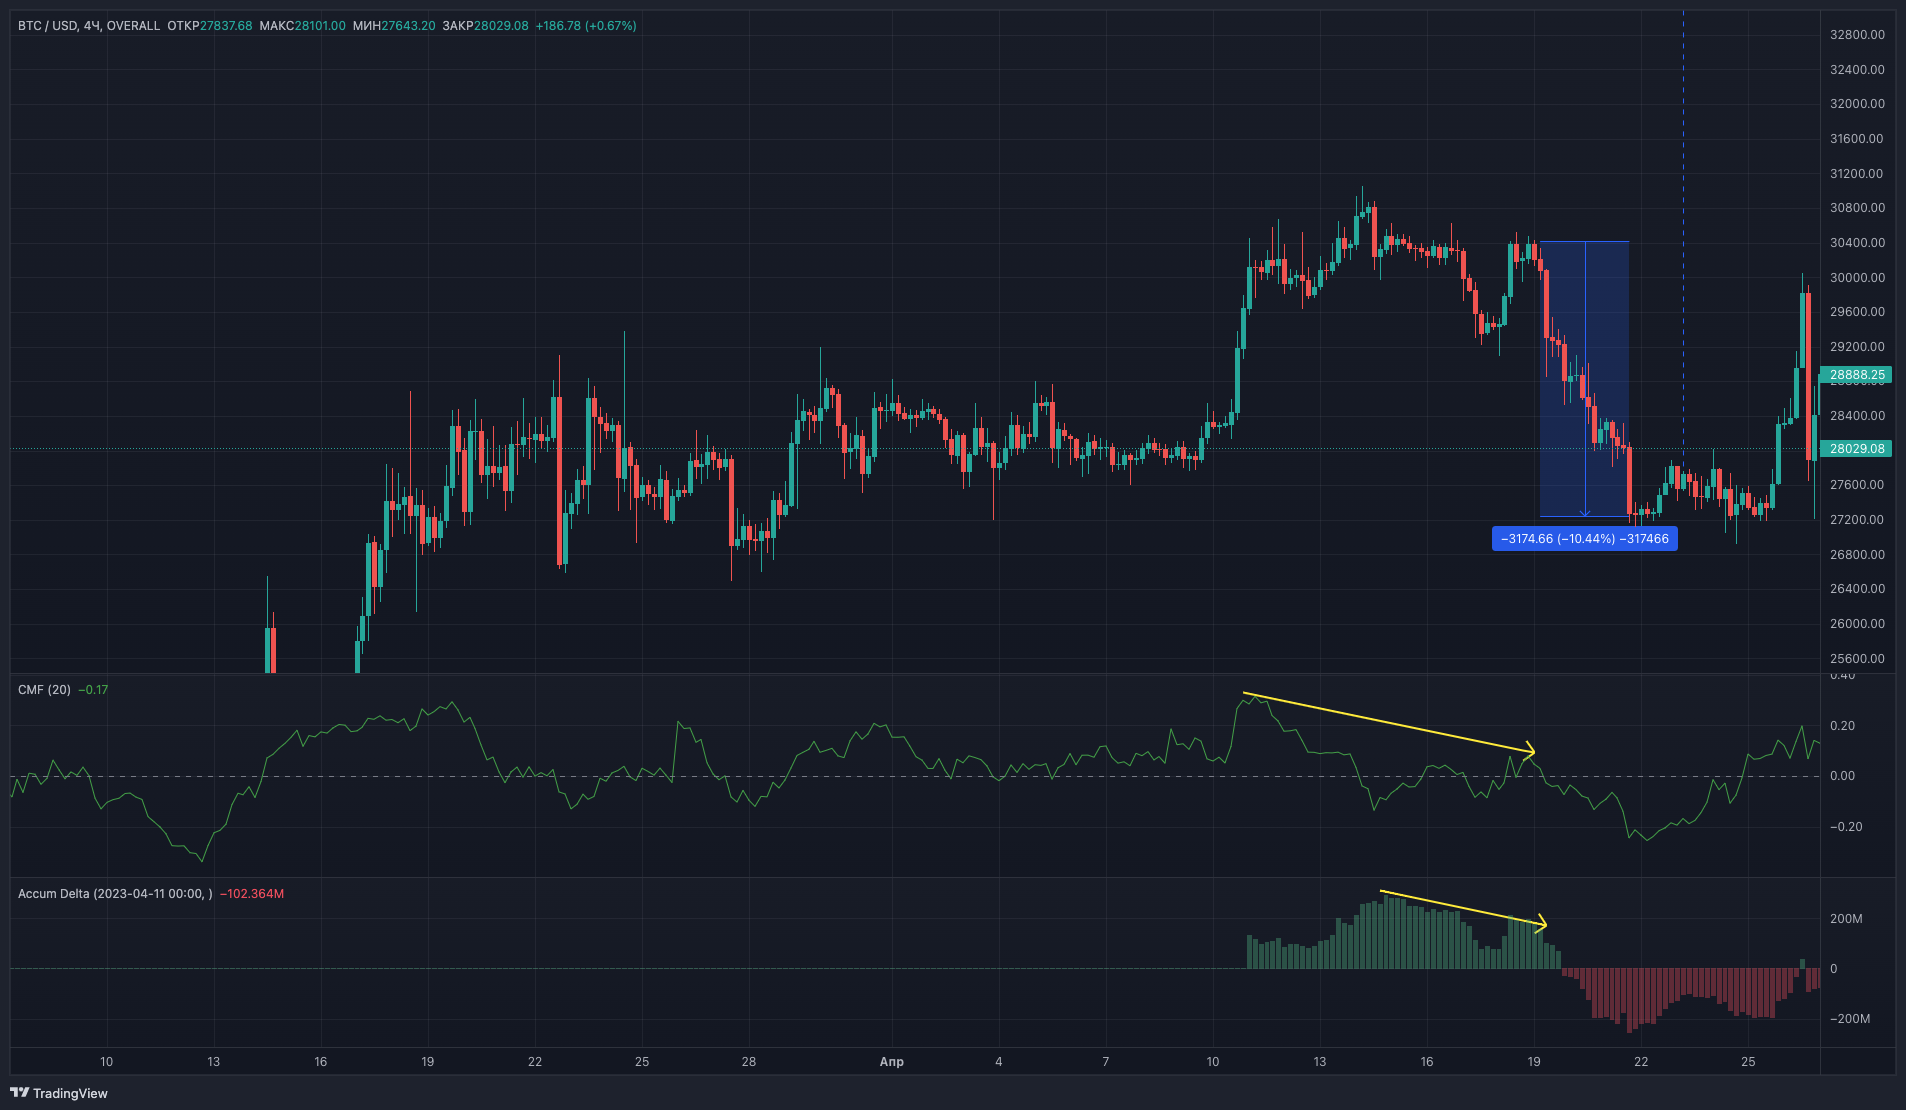
• Divergence: If the price of an asset is rising and the CMF is falling, it may indicate a complete reversal downwards.
Other trading indicators for use with CMF - Cumulative Delta
As we mentioned earlier, traders often use several indicators together to increase their chances of making profitable trades. A popular indicator that traders use in conjunction with the CMF is the cumulative delta.
Cumulative Delta (CD) is an indicator that tracks the difference between buying volume and selling volume to determine buyer or seller pressure in the market. Combining a CMF with a CD can improve signals and reduce false positives.
This is discussed in more detail in our article:
What is delta and cumulative delta in Cryptovizor?
Use of indicators in a pair:
• If the CMF and CD are positive and rising, it indicates strong buying pressure and the possibility of an uptrend.
• If the CMF and CD are negative and falling, it indicates strong seller pressure and the possibility of a downtrend.
• If the CMF and CD are ambiguous or fluctuate around zero, it may indicate an uncertain trend and the possibility of a sideways market movement.
Using indicator matching signals for entering and exiting positions:
• Entering long: If the CMF crosses the zero line from bottom to top and the CD is also rising, this could be a buy signal
• Entering short: If the CMF crosses the zero line from top to bottom and the CD is also falling, this may be a sell signal
If the CMF and CD show opposite signals, it indicates uncertainty in the market and the possibility of a trend change or correction. In such situations, it is advisable to proceed with extreme caution and consider the following tips:
it is better to take a conservative position and wait for both indicators to equalize and confirm the same trend. At the same time, it is important to watch for changes in market dynamics and adapt your strategy accordingly.
Additional analysis
Include other technical indicators and analyze charts at different time frames to get a more accurate picture of the market situation. Using additional indicators such as moving averages, RSI or MACD can help confirm or refute conflicting signals from the CMF and CD.
Using CMF in combination with cumulative delta, traders can increase their chances of making profitable trades and minimize losses.
Risk management
If you decide to enter a position based on conflicting signals, it is important to strengthen your risk management. Set stop losses based on support and resistance levels and, if possible, use position management techniques such as splitting a position or scaling an exit.
Application of CMF to different trading strategies - scalping, intraday, swing trading
CMF can be used in different trading strategies, including scalping, intraday and swing trading.
Scalping is a trading strategy that involves making several trades throughout the day with the goal of making a small profit on each trade. Traders can use CMF to identify potential buy or sell signals for short-term trades.
Intraday trading involves making trades within a single trading day. Traders can use the CMF to identify potential buy or sell signals for intraday trades.
Swing trading involves holding positions for several days or weeks. Traders can use the CMF to identify potential buy or sell signals for long-term trades.
Fundamental analysis
In case of uncertainty, pay attention to fundamental factors that may affect the asset. News, economic indicators and corporate events can play a role in trend reversals and cause conflicting signals from indicators.
In general, contradictory signals from CMF and CD can serve as a warning of possible volatility in the market. In such cases, it is best to proceed with caution, use additional indicators and analyze a wide range of information to make informed decisions.
Using Cryptovizor for CMF analysis
Cryptovizor is a popular cryptocurrency trading screener that offers advanced charting tools and trading indicators, including CMF. Traders can use Cryptovizor to analyze CMF values on various assets and identify potential buy or sell signals.
In addition, Cryptovizor offers a number of other trading indicators and tools that traders can use in conjunction with CMF. These include Fibonacci corrections, moving averages and Bollinger Bands.
Conclusion
Using the Chaikin Money Flow indicator in conjunction with the cumulative delta can help traders better determine trend strength, improve signal accuracy and reduce the likelihood of false positives. It is important to remember that no indicator is 100% reliable and it is important to use risk management and additional analysis tools to identify appropriate strategies
Cryptovizor is a Binance cryptocurrency screener that traders can use to analyze CMF values and identify potential buy or sell signals. Using this platform and other trading indicators, traders can maximize their profits and minimize losses in the cryptocurrency market.