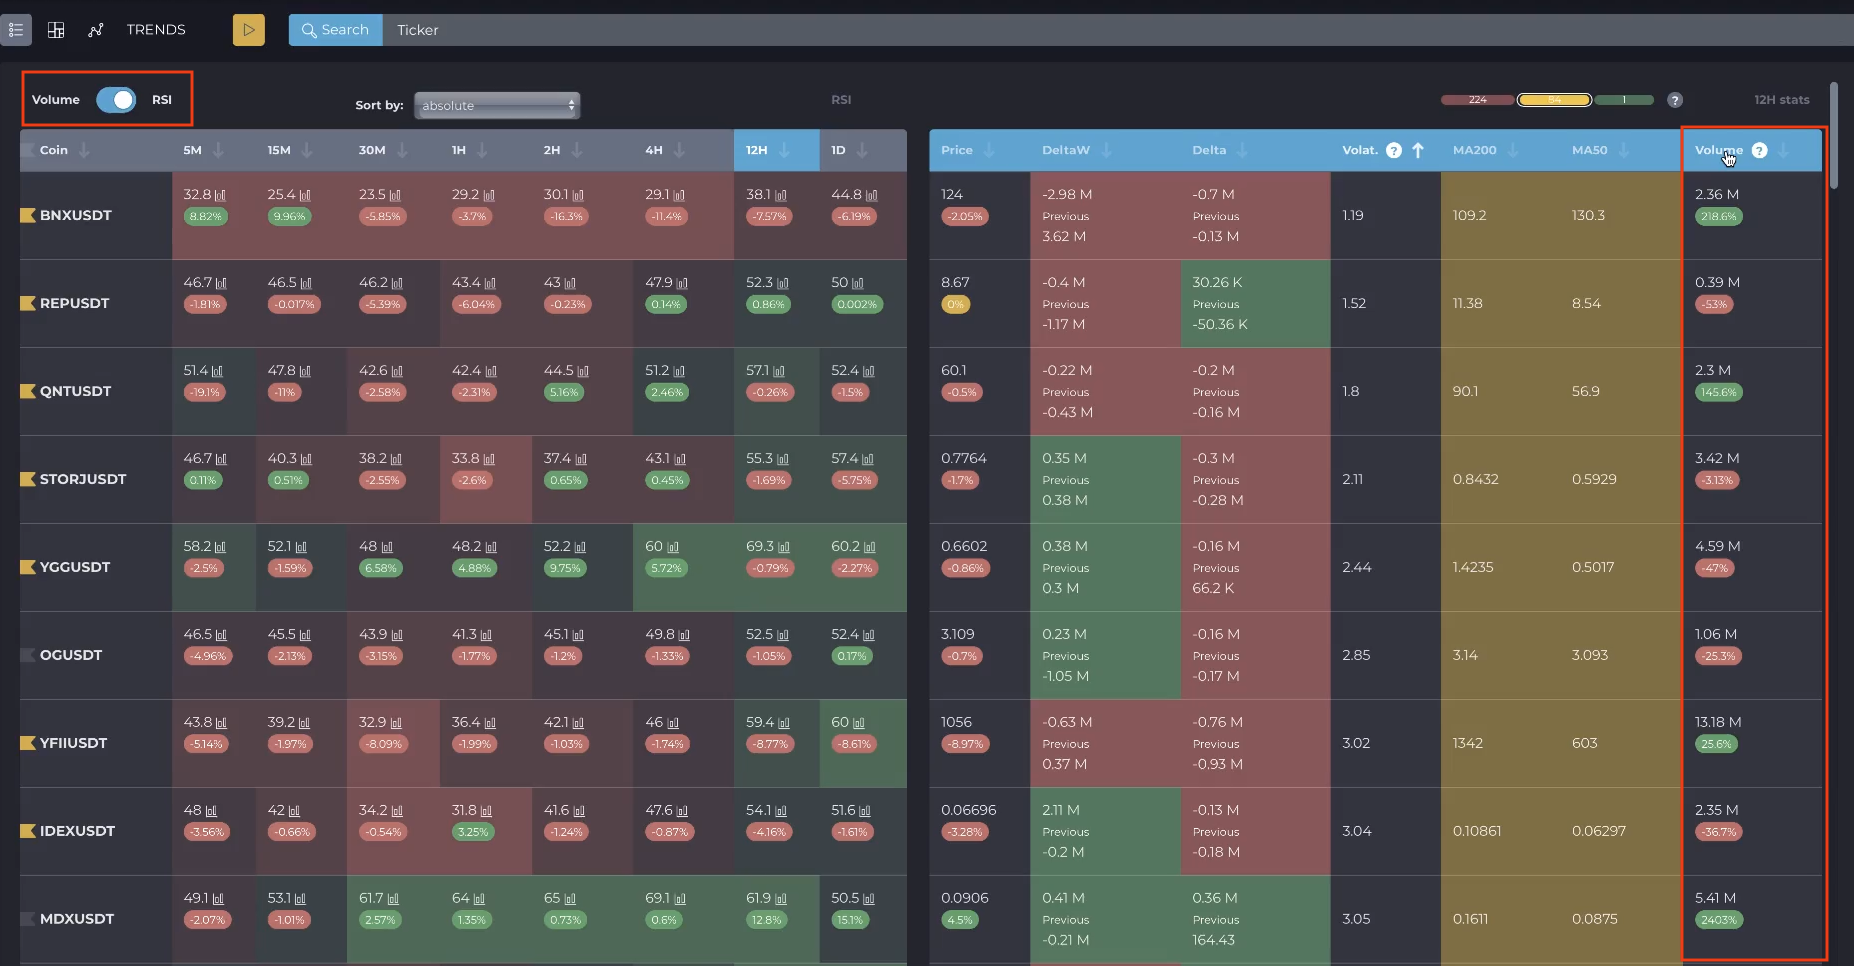

The CryptoScreener module stands as a dynamic, dual-block table designed to streamline the process for traders looking to swiftly sort, filter, group, and analyze cryptocurrencies on Binance, including crypto futures. This module furnishes traders with actionable cryptocurrency signals, empowering them to make informed buy or sell decisions in line with their selected trading strategies, thereby facilitating successful cryptocurrency trading endeavors.
Acting as the cornerstone of Cryptovizor, the CryptoScreener module elevates the platform to a premier cryptocurrency monitoring and trading solution, indispensable for traders aiming to navigate the complexities of the cryptocurrency markets with precision and efficiency.
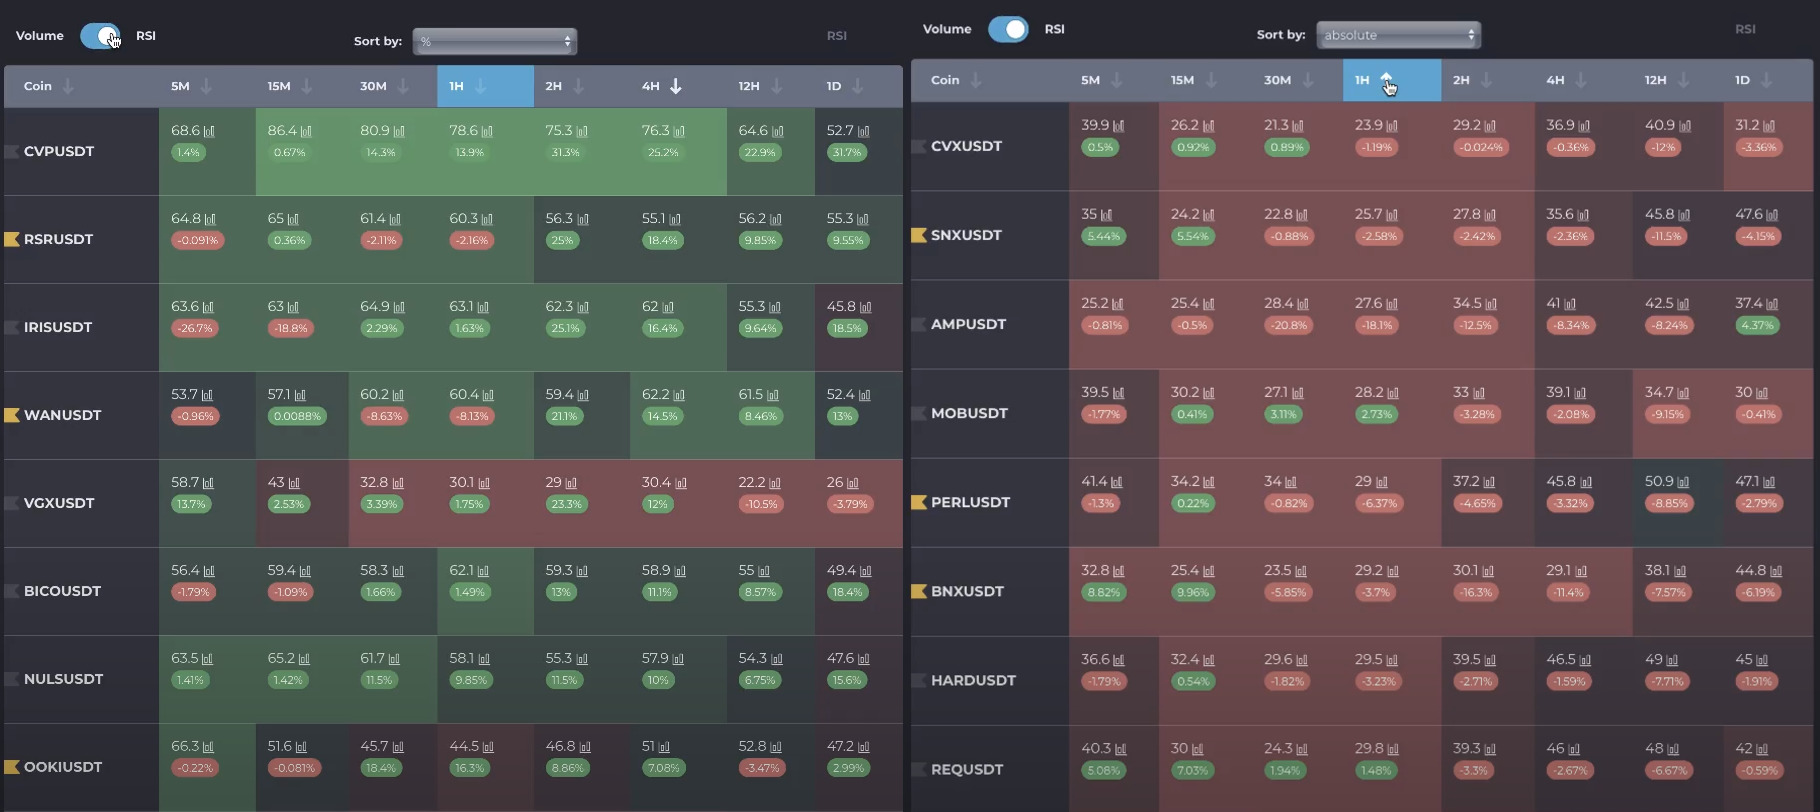
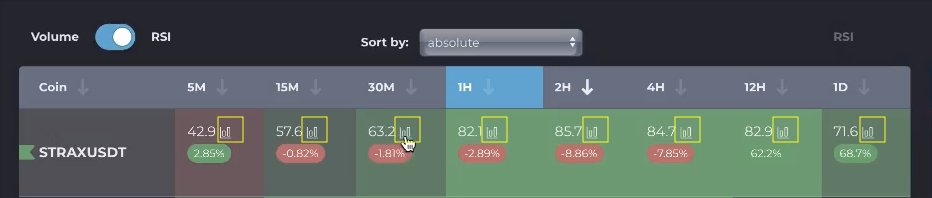
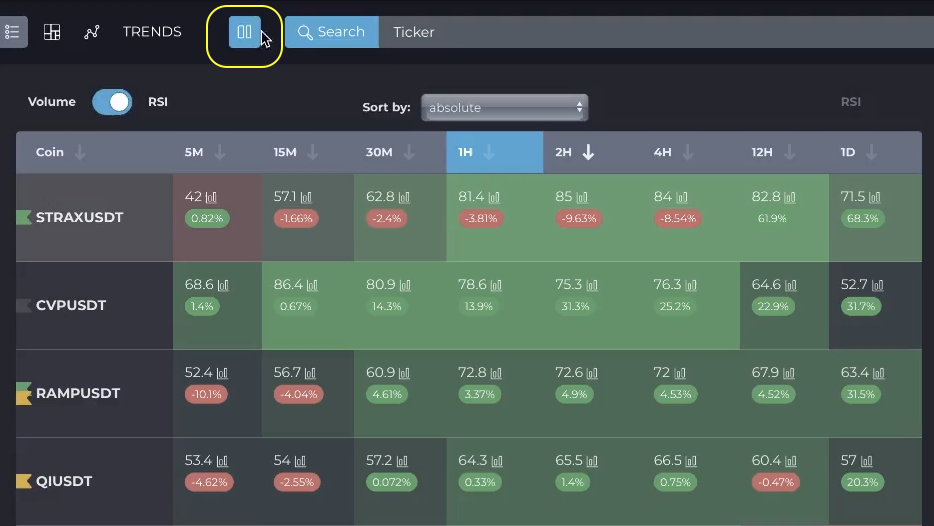
Volume & RSI switch
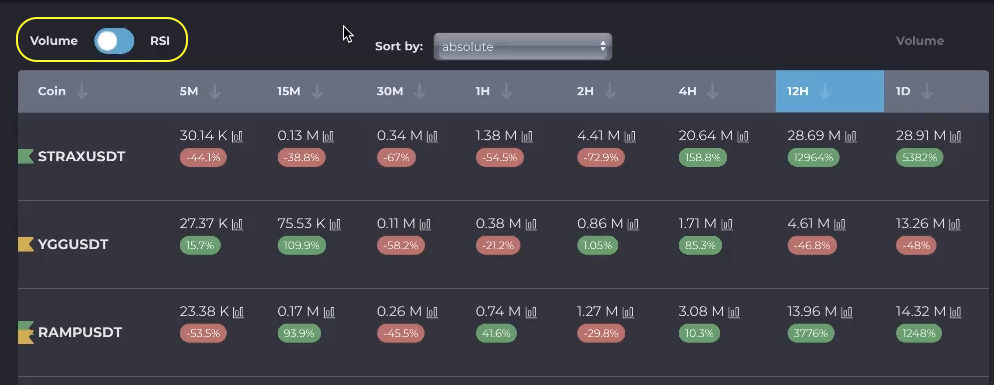
The indicators of cryptocurrencies presented in the module depend on the parameter selected by the user. The left block of the table has a switch for its display parameter - Volume & RSI.
Volume means trading volume in USDT. We use a moving method of trading volume calculation, which shows the value of the current moment minus N periods ago, where N is the selected timeframe.
The moving and per-bar trading volumes differ in that when the candle closes, the volume value is not reset to zero.
Why is trading volume important?
Trading volume is a figure that shows the number of purchases and sales in USDT over a certain period of time.
Thanks to the volume, you can see the existing demand for the cryptocurrency and compare it with the price movement. On sharp bursts of volumes, either a very rapid growth of the coin due to purchases, or a sharp drop in its price; this indicates large sales. Thus, cryptocurrency trading is carried out using USDT volumes.
Screener table left block
To sort coins alphabetically, click on the arrow in the Coin column.

Table columns from 5 minutes to 1 day are timeframes that can be selected by clicking on the column name.

Each column's data can be sorted. When you click on a timeframe, the trend is filtered by the selected timeframe, and when you click on the arrow next to the timeframe, it sorts in ascending or decreasing order of the argument selected in the Volume & RSI switcher.

Sorting of columns is available both by absolute and by percentage values.

Absolute values are the volume of trades in USDT stablecoins (thousands, millions or billions).
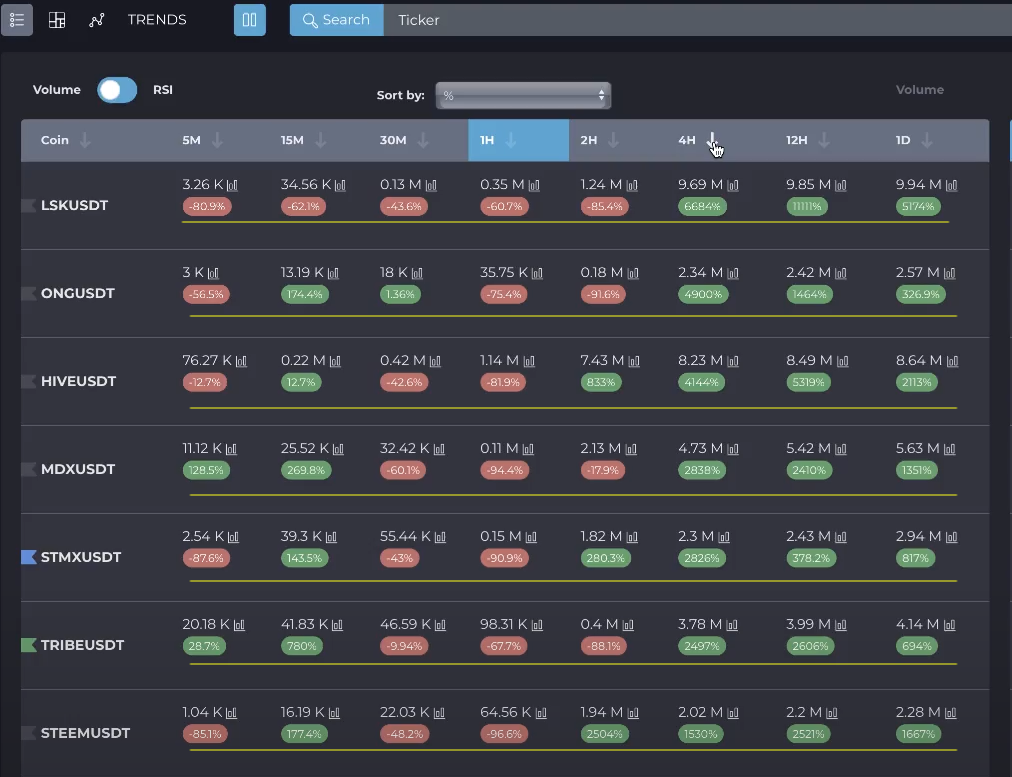
In the cells of the table, the percentage changes in absolute values are located below the absolute values - in red, green or yellow ellipses.
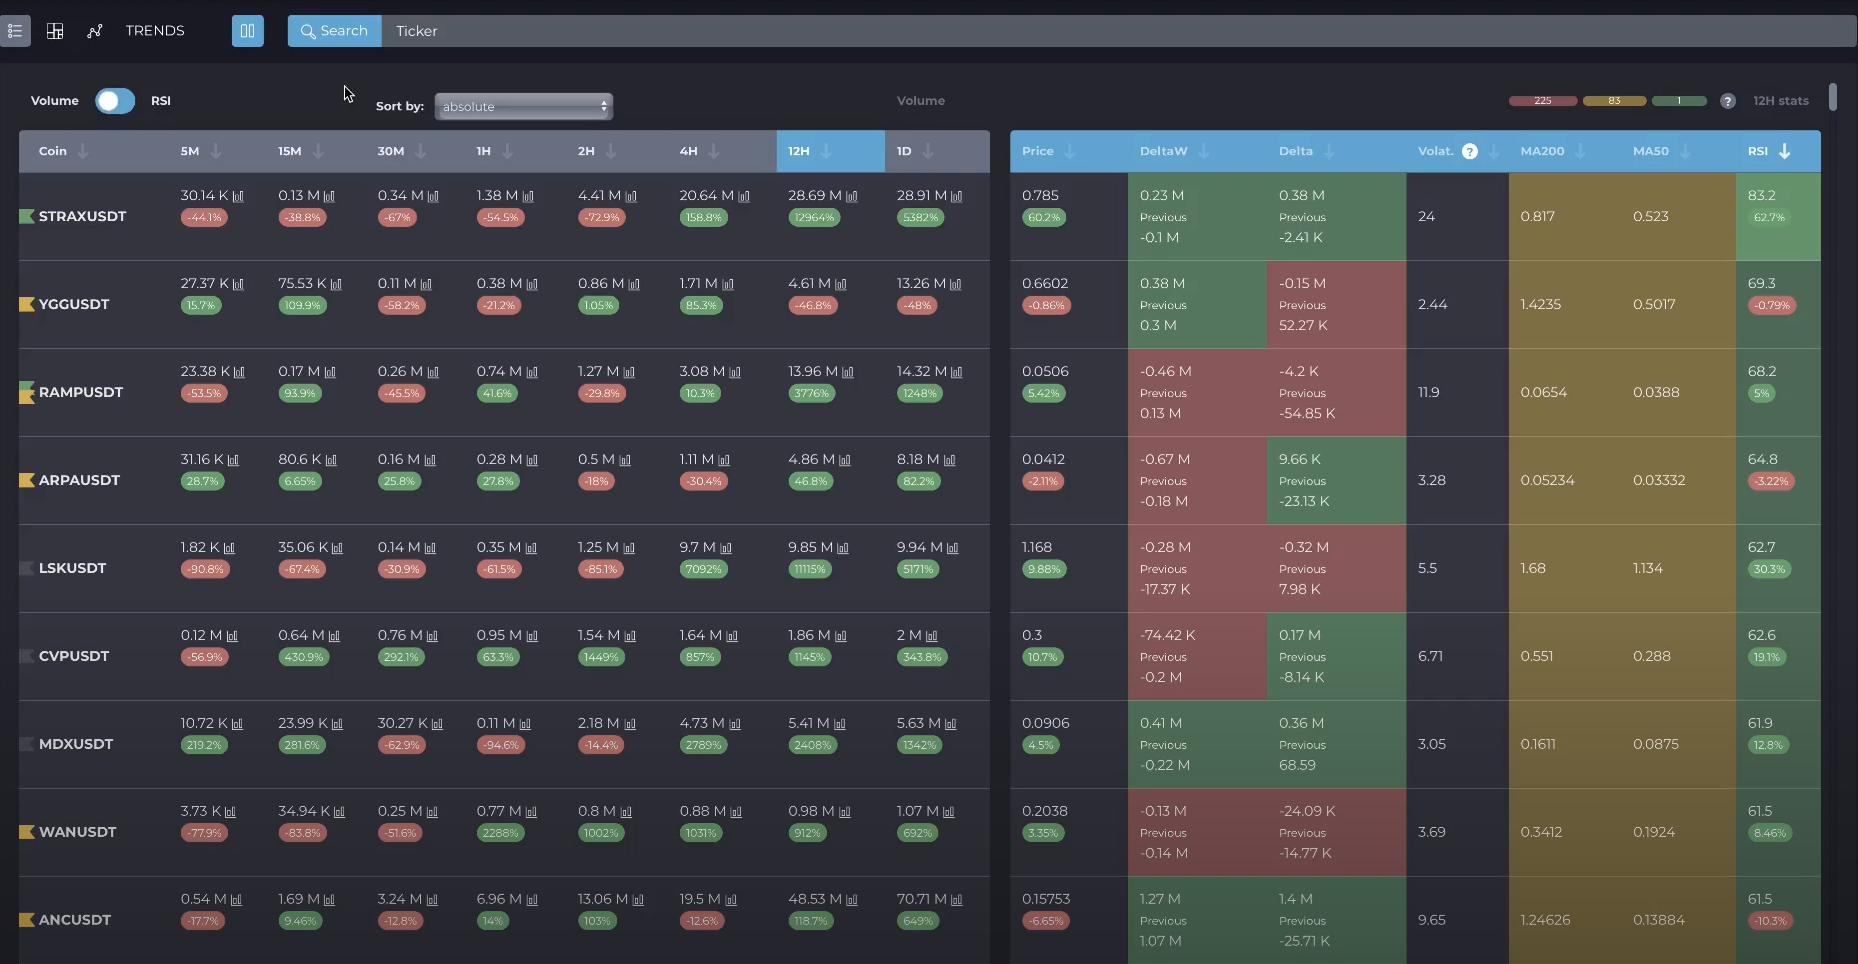
Switch in RSI position

When the Volume & RSI switch is in the RSI position, the columns with the corresponding timeframes display the values of this parameter. In this case, the table cells are highlighted with a gradient of six shades, depending on the absolute value of RSI.
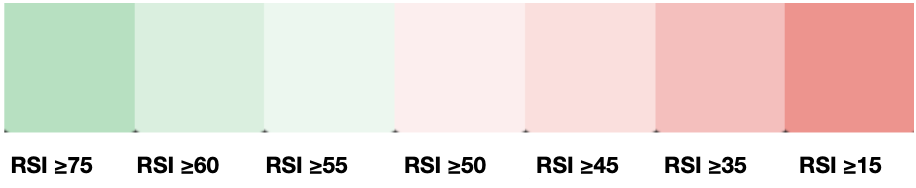
Bright red indicates the strongest downward movement, while bright green indicates the strongest upward price movement.
When calculating RSI, we use the standard 14-period value.
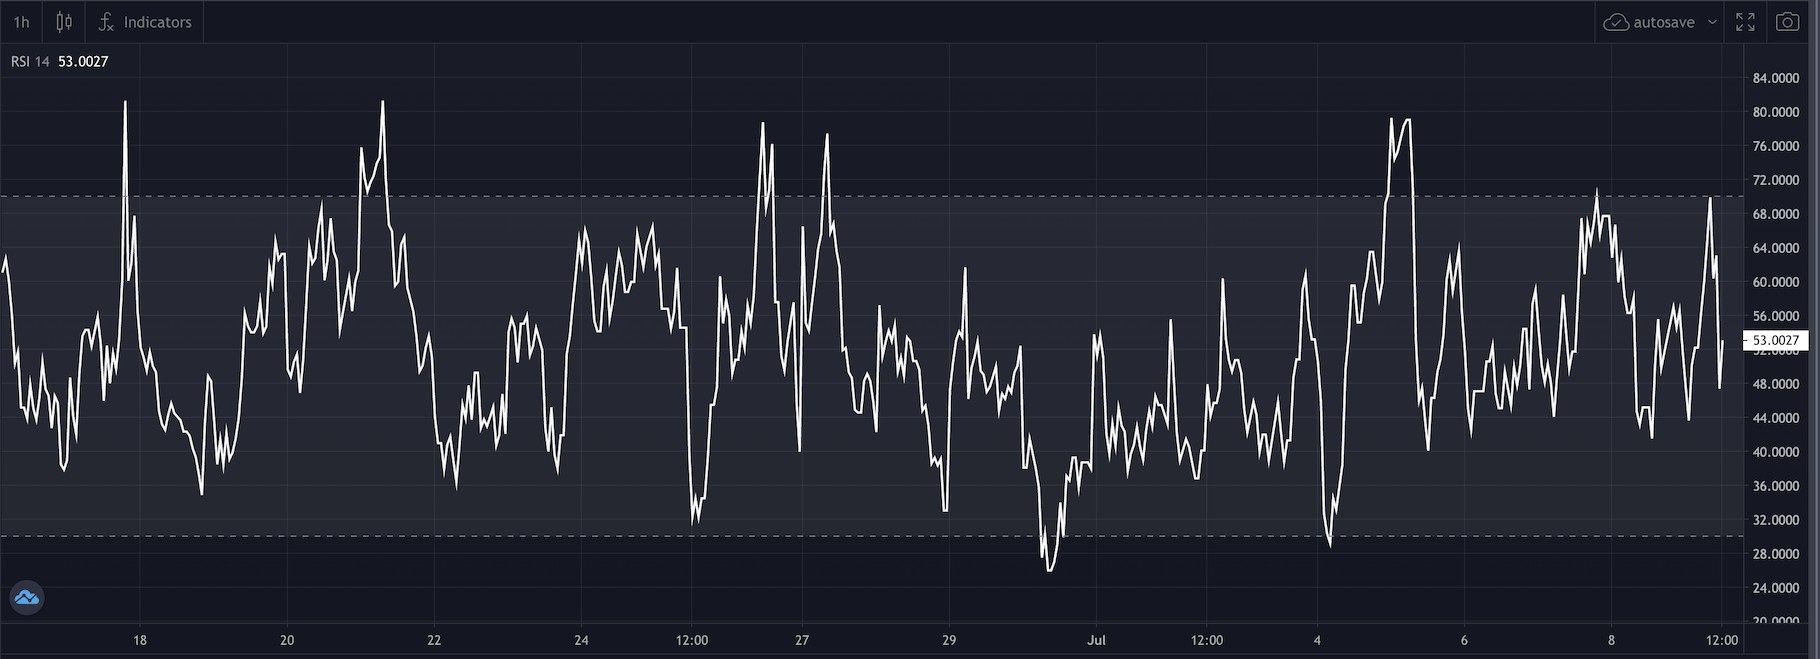
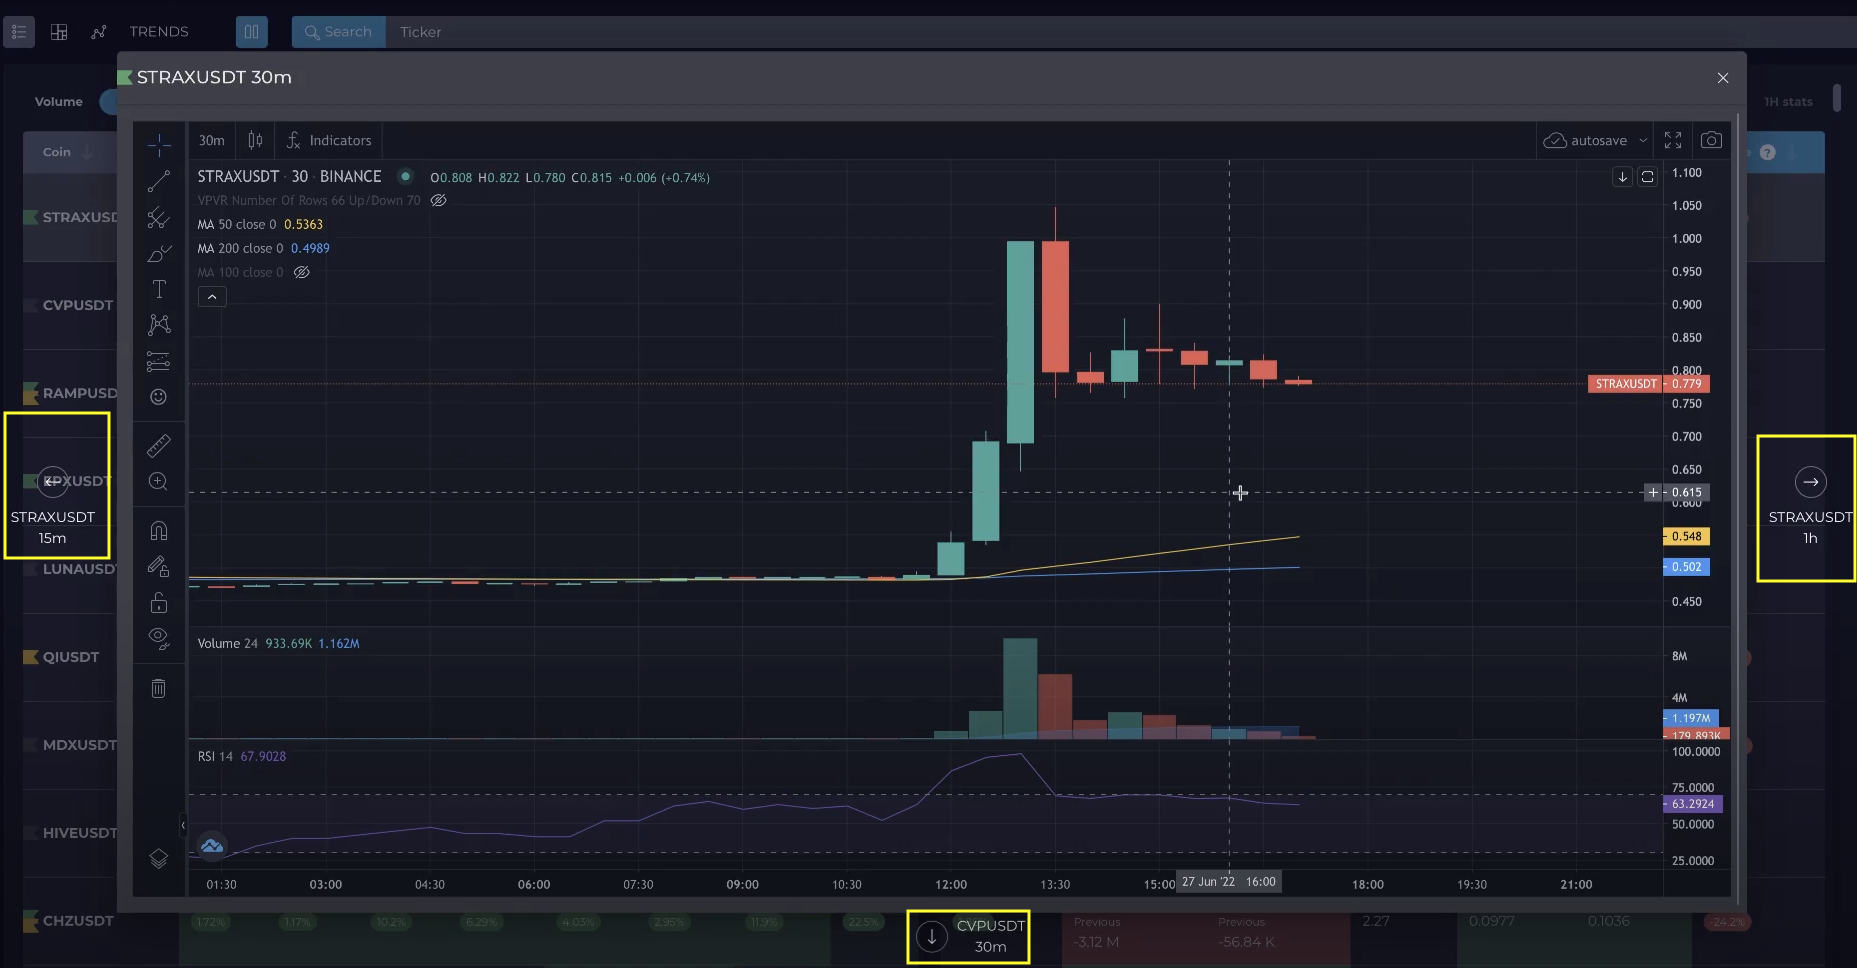
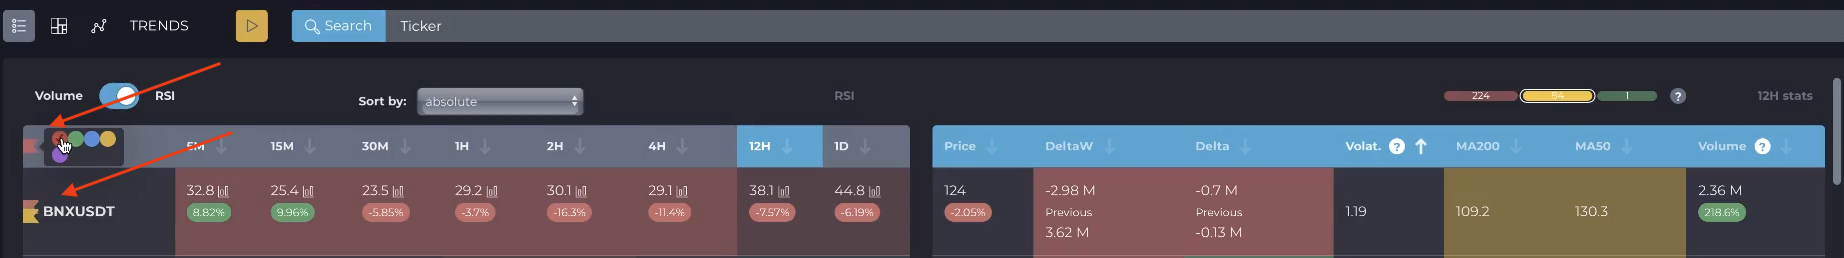
Cryptovizor is a cryptocurrency screener with charts. Each table cell has an icon next to the absolute value of Volume or RSI. Clicking on this icon allows you to open the chart of the corresponding timeframe.
You can navigate between timeframes using the computer keyboard arrows or graphic buttons to the left and right of the chart, or using the switch bar in the upper left corner.
To move to the next or previous ticker, use the keyboard arrows or the buttons at the top and bottom of the chart.
You can also add standard indicators from the TradingView library, create your own markup, or set up notifications directly from the chart.
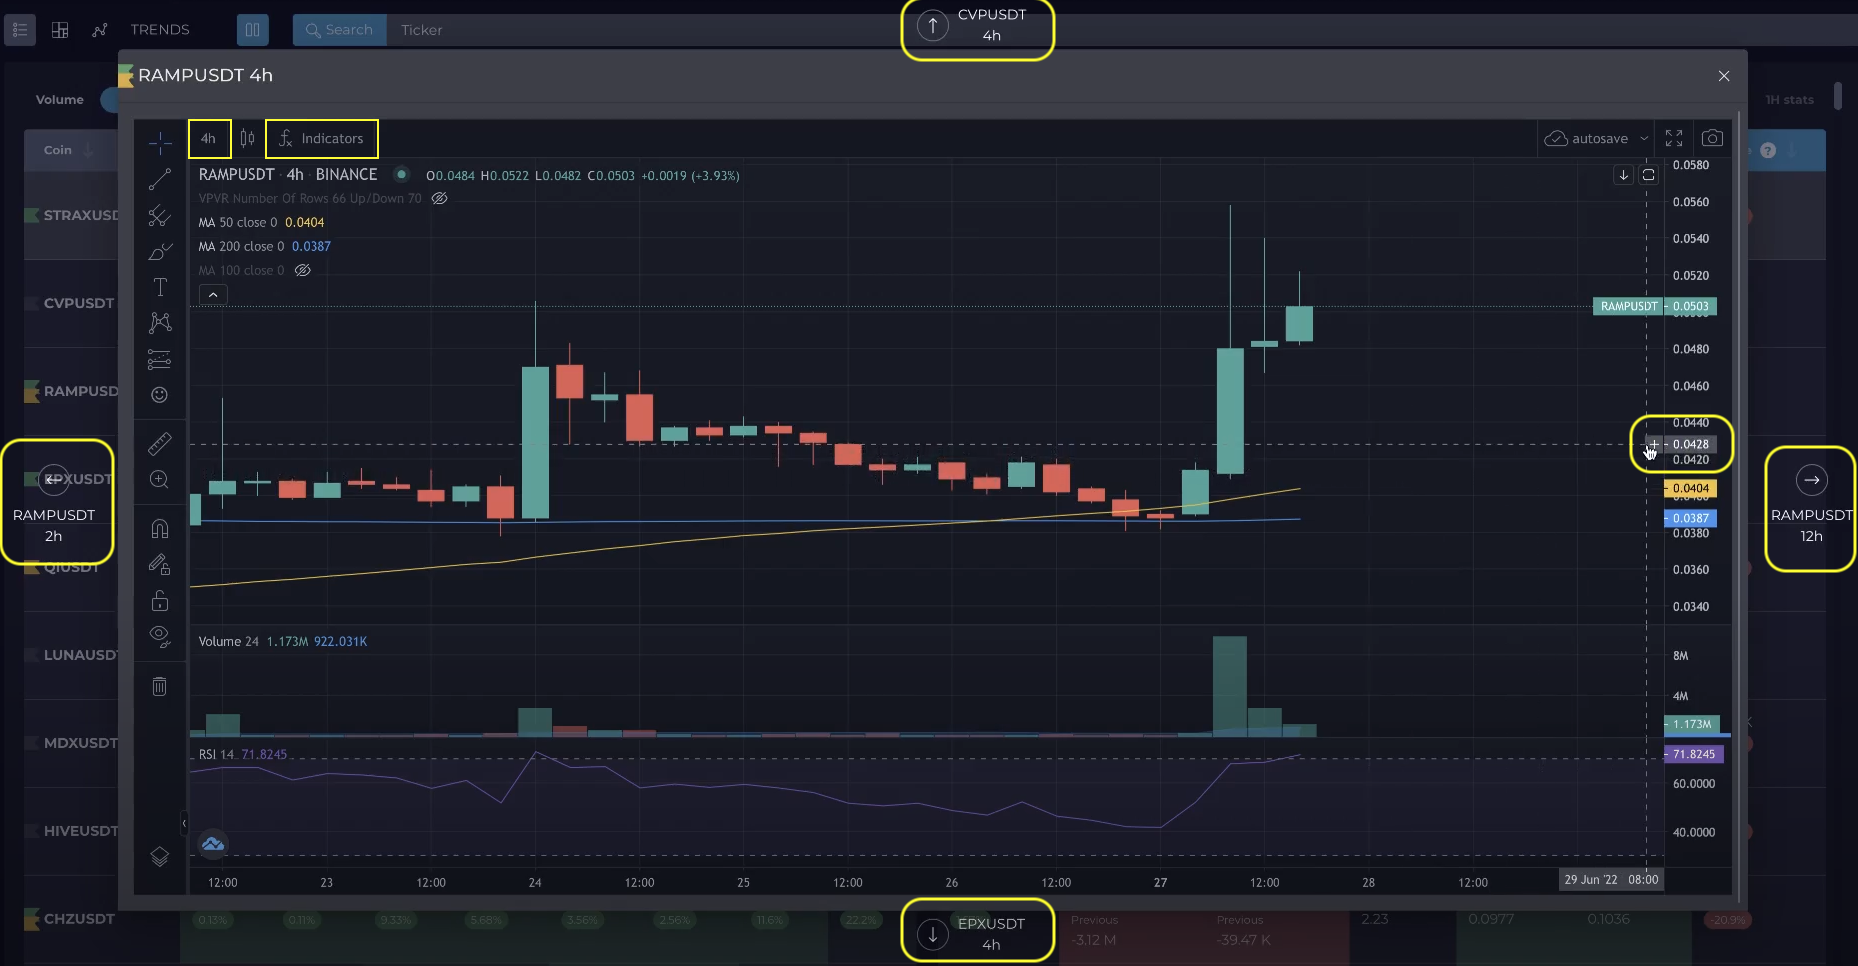
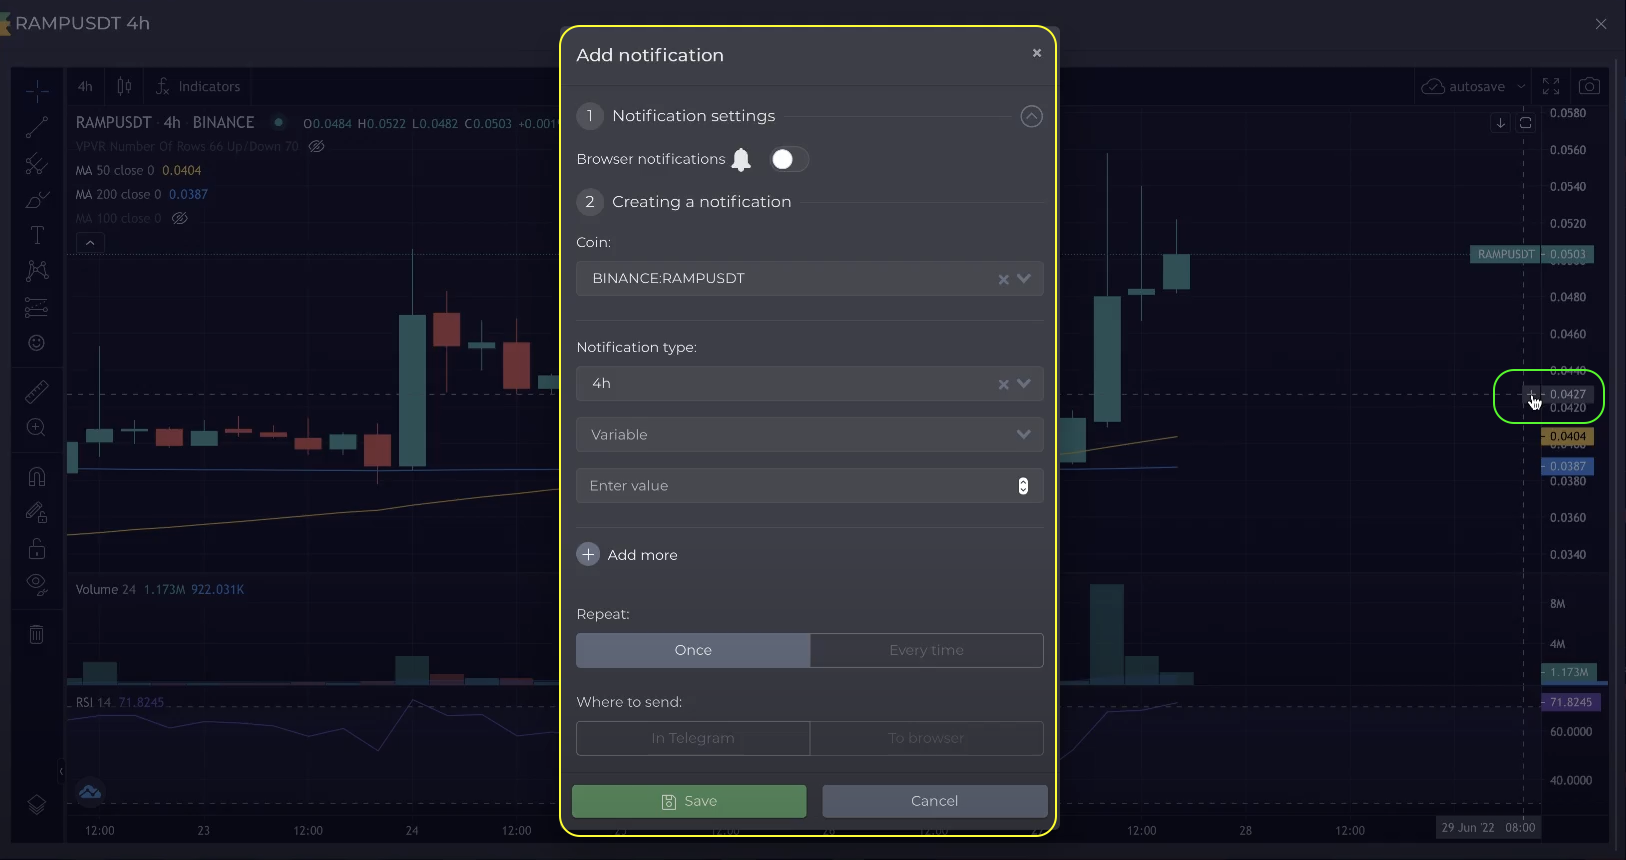
To create a notification, click on the plus symbol next to the price scale. A window for creating a notification will open. In this window, you can set the necessary parameters, select a timeframe, and also send a notification to Telegram or to the browser.
Pressing the ESC button on the keyboard closes the chart window.
The pause button stops background data refresh in the table. Click on it again to start the screener again.
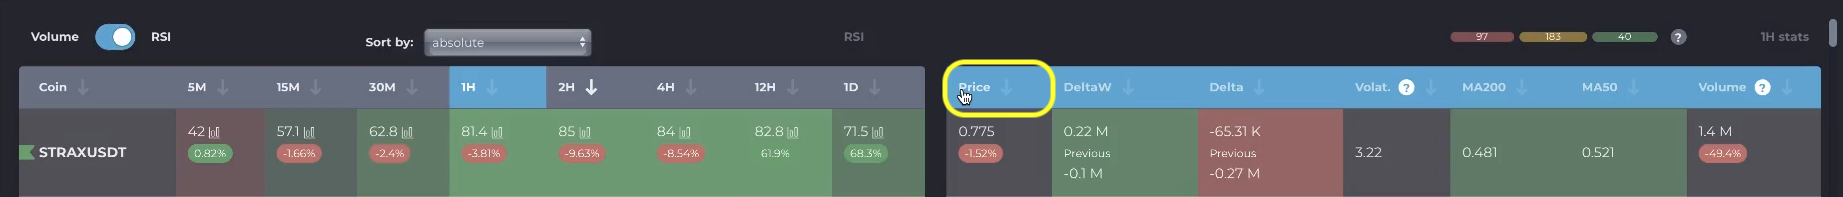
Screener table right block
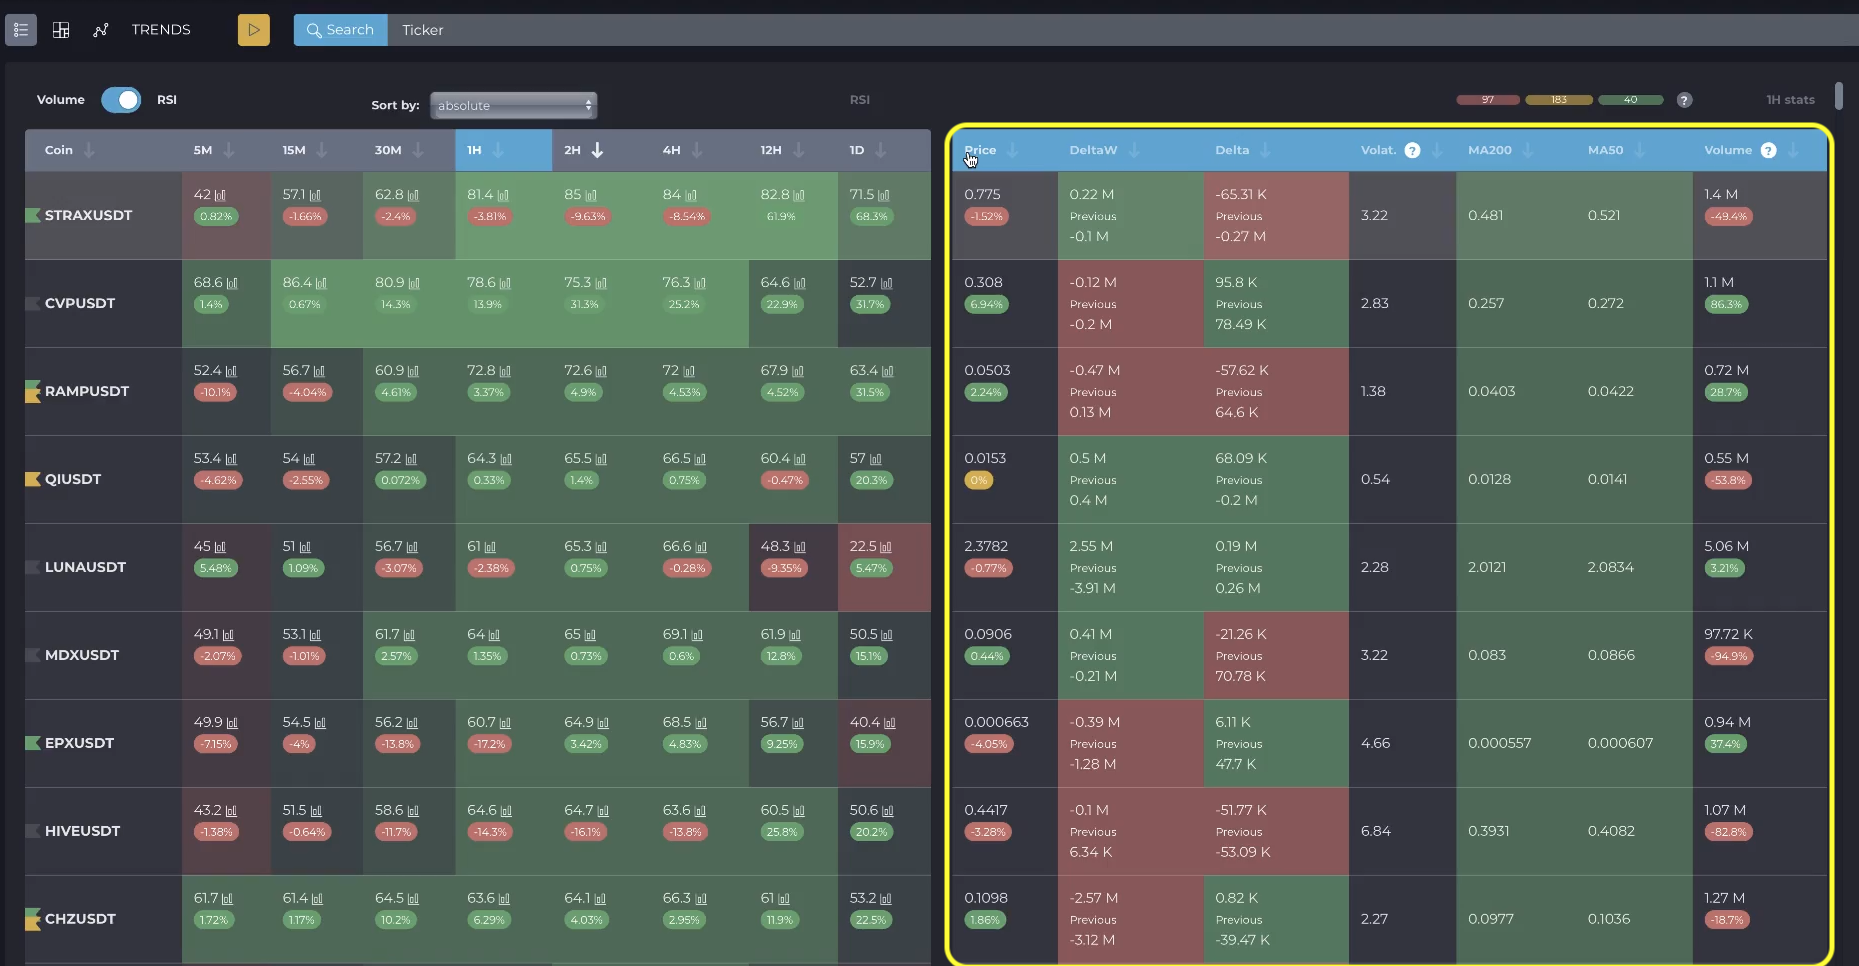
The right block shows information on the ticker in the selected timeframe.
You can sort data by absolute values by clicking on the column name; clicking on the arrow sorts by percentage of change.
The second and third columns of the right block of the table display the difference between market buys and sells at each price, in each candle or bar. These columns use the same moving calculation method as in the case of volume calculations.
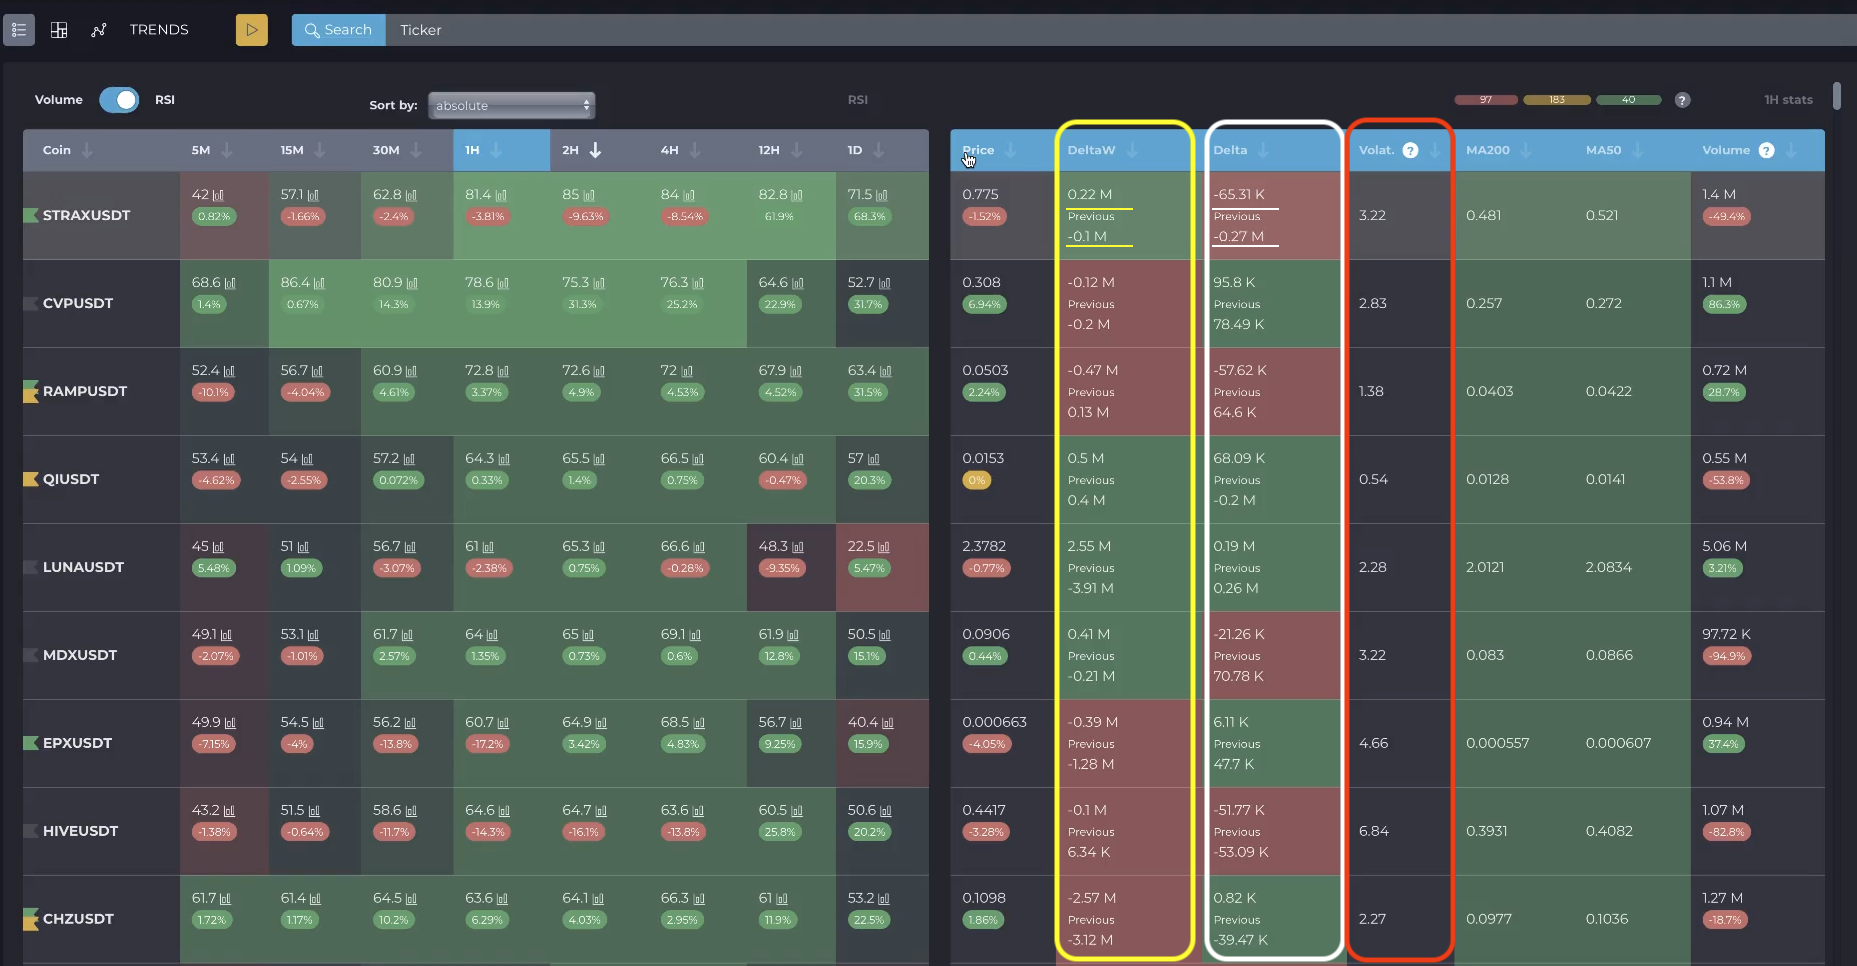
The CD Week column shows the cumulative delta for the Binance spot market week.
And the Delta column displays the delta value for the selected Binance spot market timeframe.
The bottom line shows previous values for user convenience and quick comparison.
The Volat. column (cryptocurrency volatility) displays the amplitude of the closing price change relative to the selected timeframe. The higher the value, the higher the volatility.
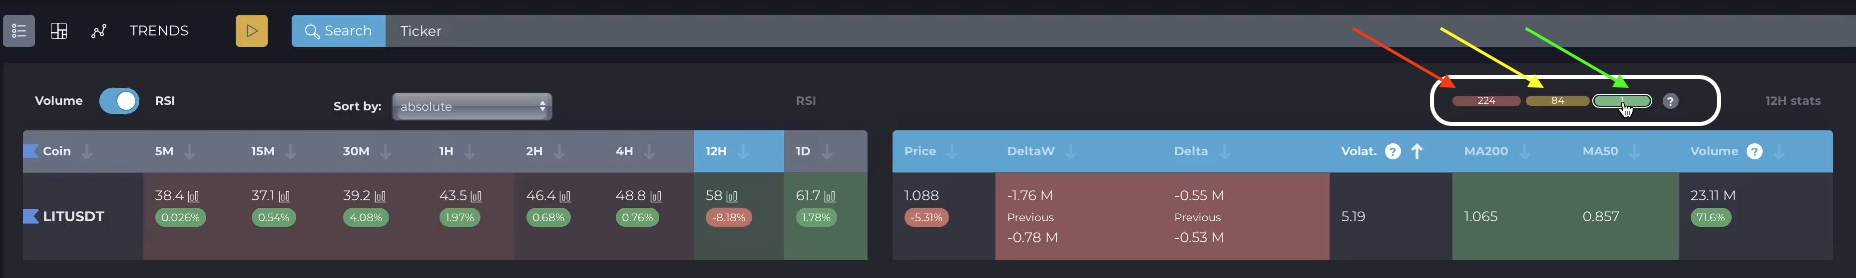
To the right above the table you can see the moving average (MA) filter, which is a tool for quickly determining the status of a trend. This filter works on the selected timeframe and is activated or deactivated when you click on the colored oval.
When the filter is enabled, a checkbox appears in the Coin column on the left side of the screener table for multiple additions to or removals from the watchlist.
The default values are MA200 and MA50. However, in the Cryptovizor settings, you can set any value of the moving averages.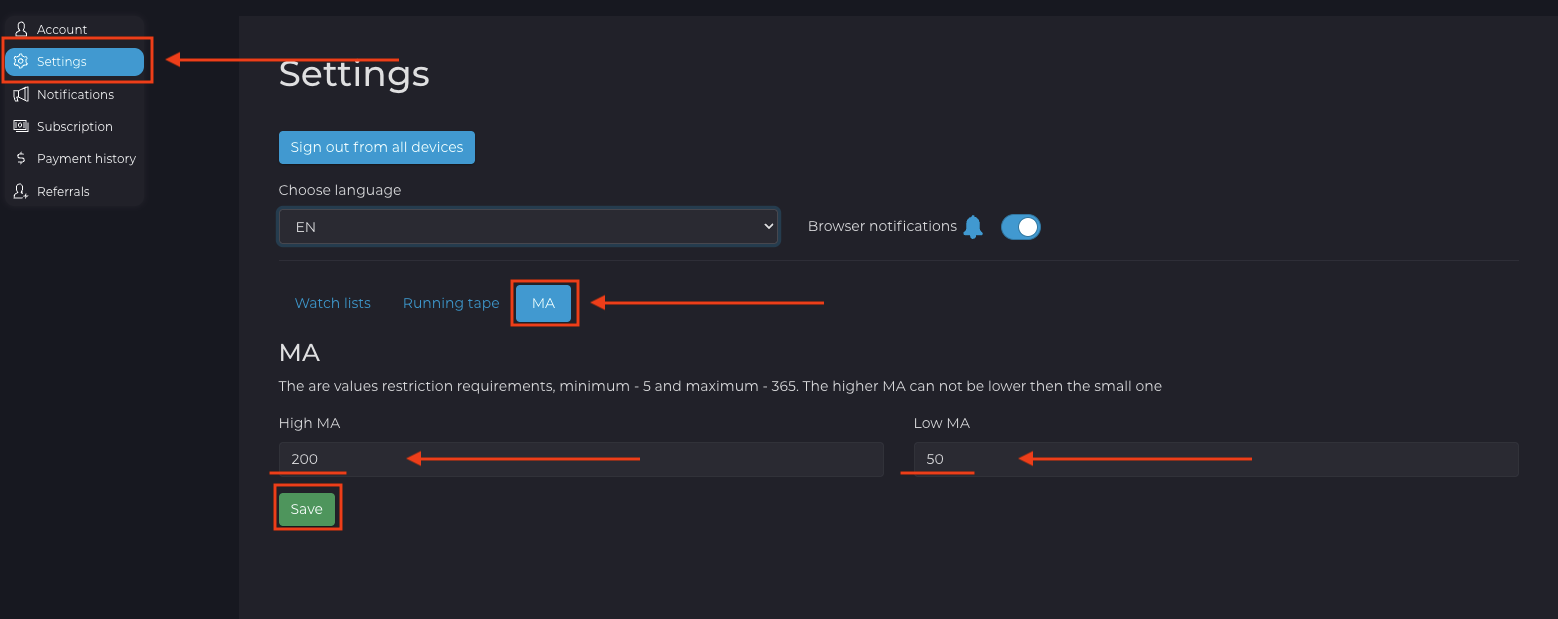
The number of coins that are related to a certain trend state is displayed inside each colored oval:
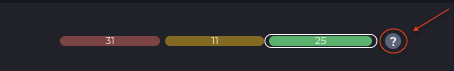
1. A downtrend is when the price value is less than the MA value. The cells are red.
2. Trader's active zone is when the price value is between the MA values. The cells are yellow.
3. An uptrend is when the price value is greater than the MA value. The cells are green.
The rightmost column changes its value depending on the selected table switch - Volume or RSI.
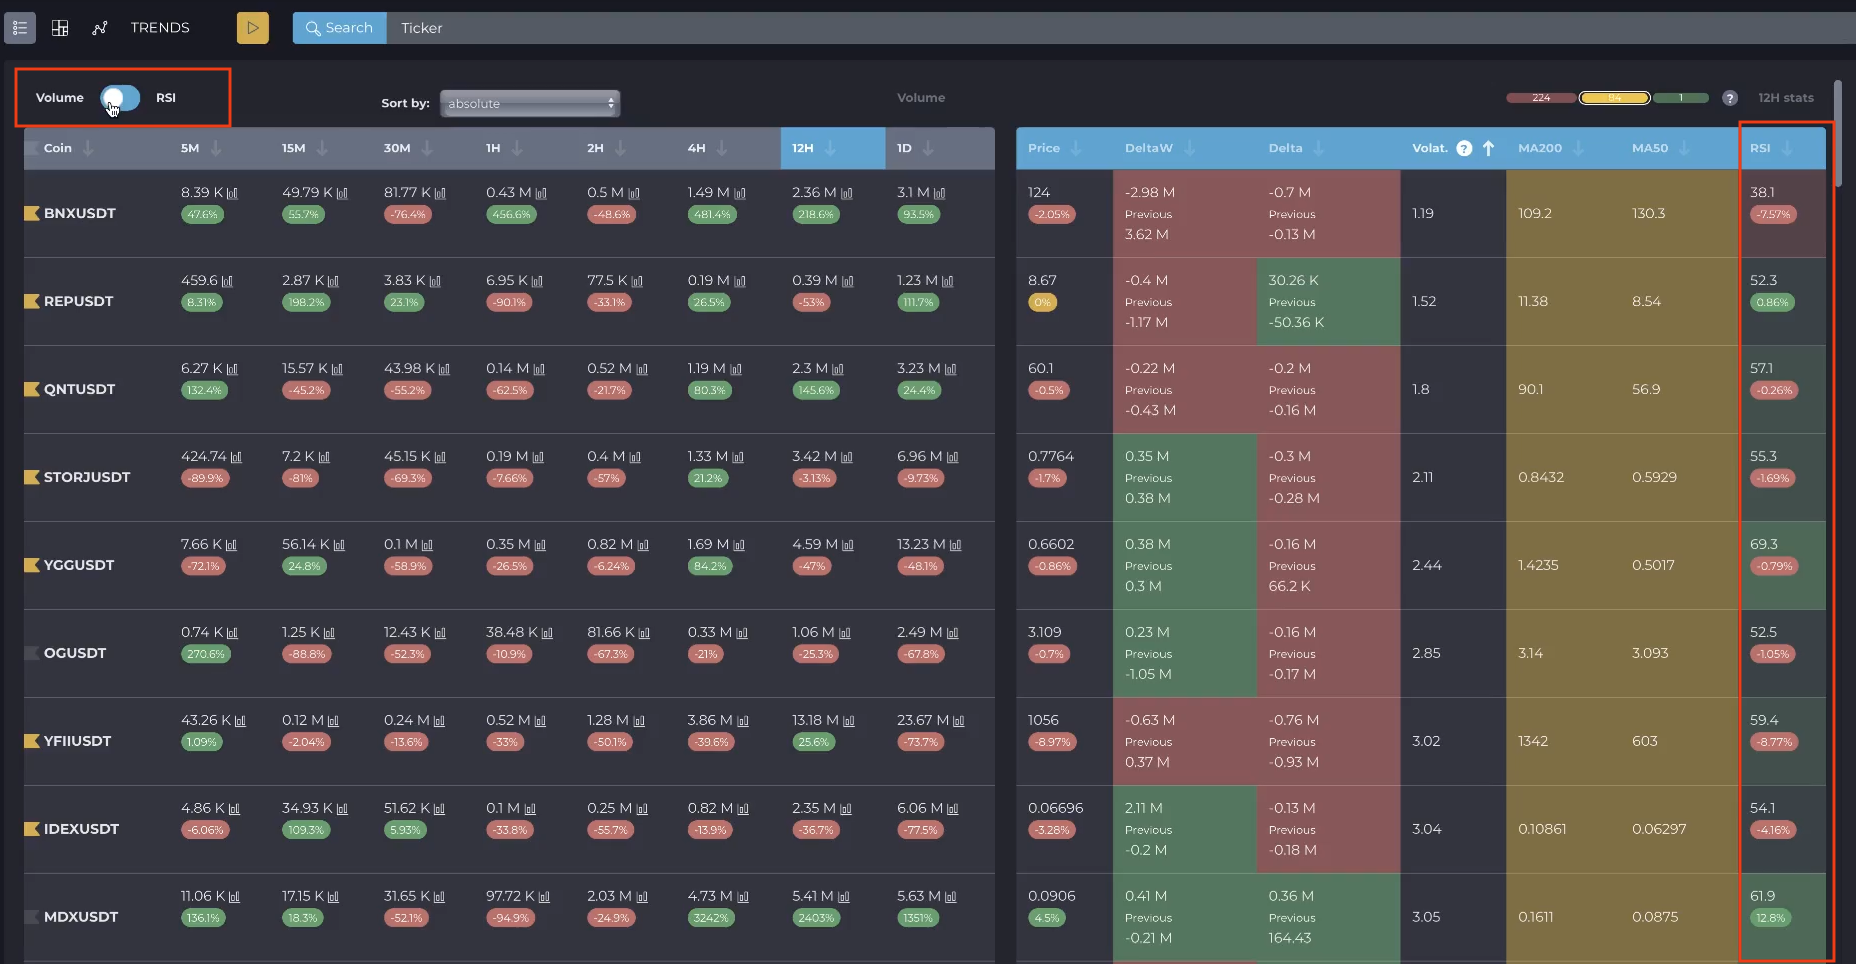
If the switch is in the Volume position, the RSI value of the current timeframe will be displayed in the rightmost column.
If the RSI table is open, then value of Volume will be displayed there.